First phase: Buying third-party monitoring software.
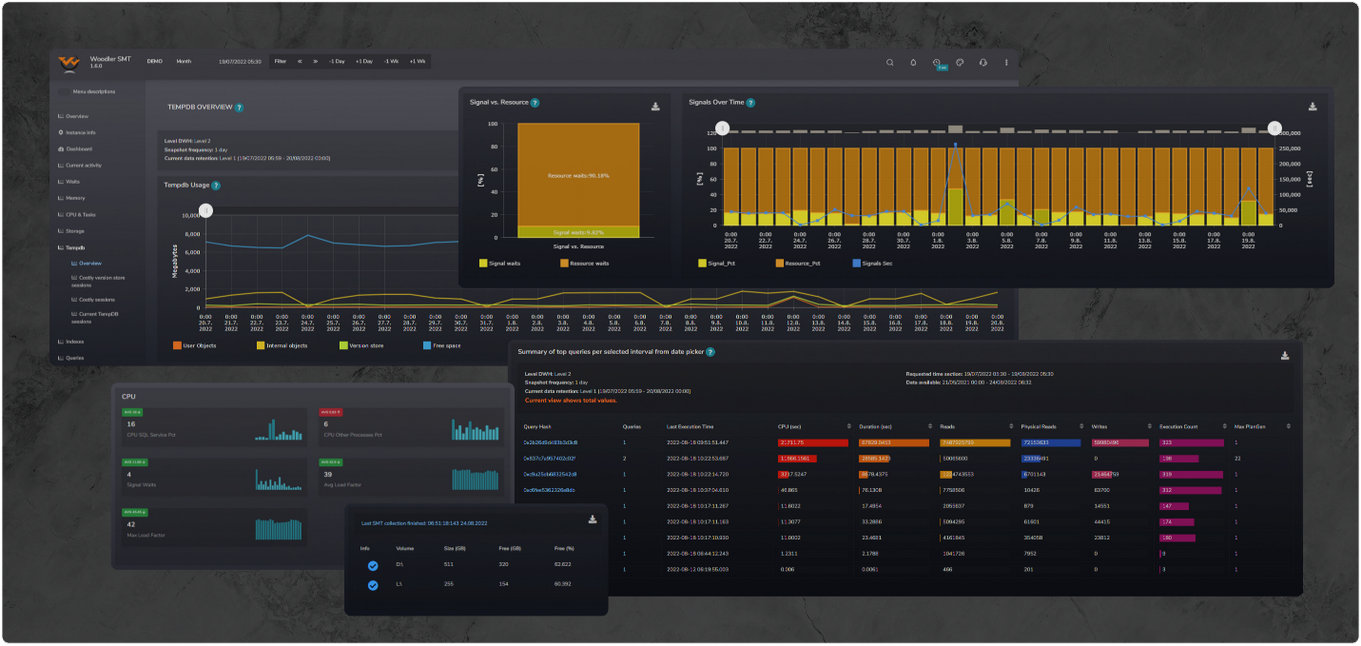
Maybe you do not know precisely at the beginning what you need to monitor, and you leave it up to the monitoring software vendor. You see shiny graphs and a lot of features, but in the end, you don't know how to represent the results correctly.
You googled several metrics and learned how to represent them, but the rest of the monitored data is not helpful.
Or you might find some other beneficial metrics missing in the tool, but developers have not resolved your feature request for years.
In the end, you find that team members are not using the tooling, so you stop paying for it.
Second phase: Try on your own.
After passing some free courses on monitoring SQL Servers, you decided to start your internal monitoring project. You allocate some internal resources to develop the prototype and deploy it on your SQL Servers.
During development, you find many caveats in collecting and representing specific things into meaningful reports that are also understandable to others.
Once you find the time, you usually get stuck on something the online documentation does not mention... and boom, 2 hours in a row spent. „This is going nowhere, “you think.
Your development time is increasing, and management requests more and more other tasks from you. Priorities might have changed, and you no longer have time to develop, maintain, extend, or bugfix your solution.
Punishment, overwhelming, resignation, remorse, and self-blame ...
„It's probably not for me ", you said several times ...
And as has happened many times before... We say ENOUGH!
Why not start cooperation with the partner with a specific performance tuning skill set, which will provide you with a monitoring tool and expertise to help you understand and represent the monitored data?