Greetings from Woodler,
We are excited to announce the release of SMT 1.12.0. In this update, we have focused on refining existing features while introducing a new optional capability that could dramatically enhance the way you proactively tune your SQL Server with SMT.
Significant Changes and Features
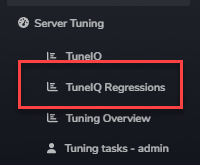
Query Regression Reporting
Our major new feature in this release builds on a prototype developed for one of our customers. Query Regression Reporting automatically analyzes collected data to identify when and which code has regressed in your SQL Server. This allows you to proactively address potential issues before users begin to notice any performance decline.
With this feature, we have seen significant improvements in the performance of mission-critical WMS and ERP systems. Please note that this feature is disabled by default and must be enabled manually.
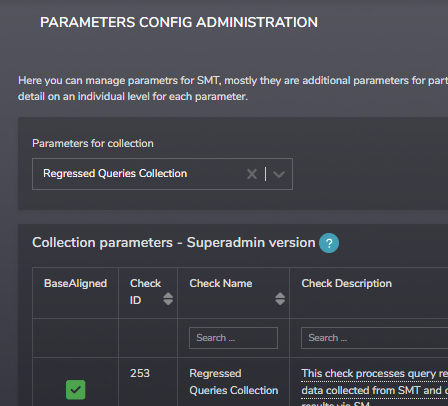
We recommend reviewing and customizing the default parameters—such as limits and filters—to align with your unique SQL Server workload. Look out for a forthcoming guidance post in our SMT documentation for configuration tips.
Instance Info Report Upgrade
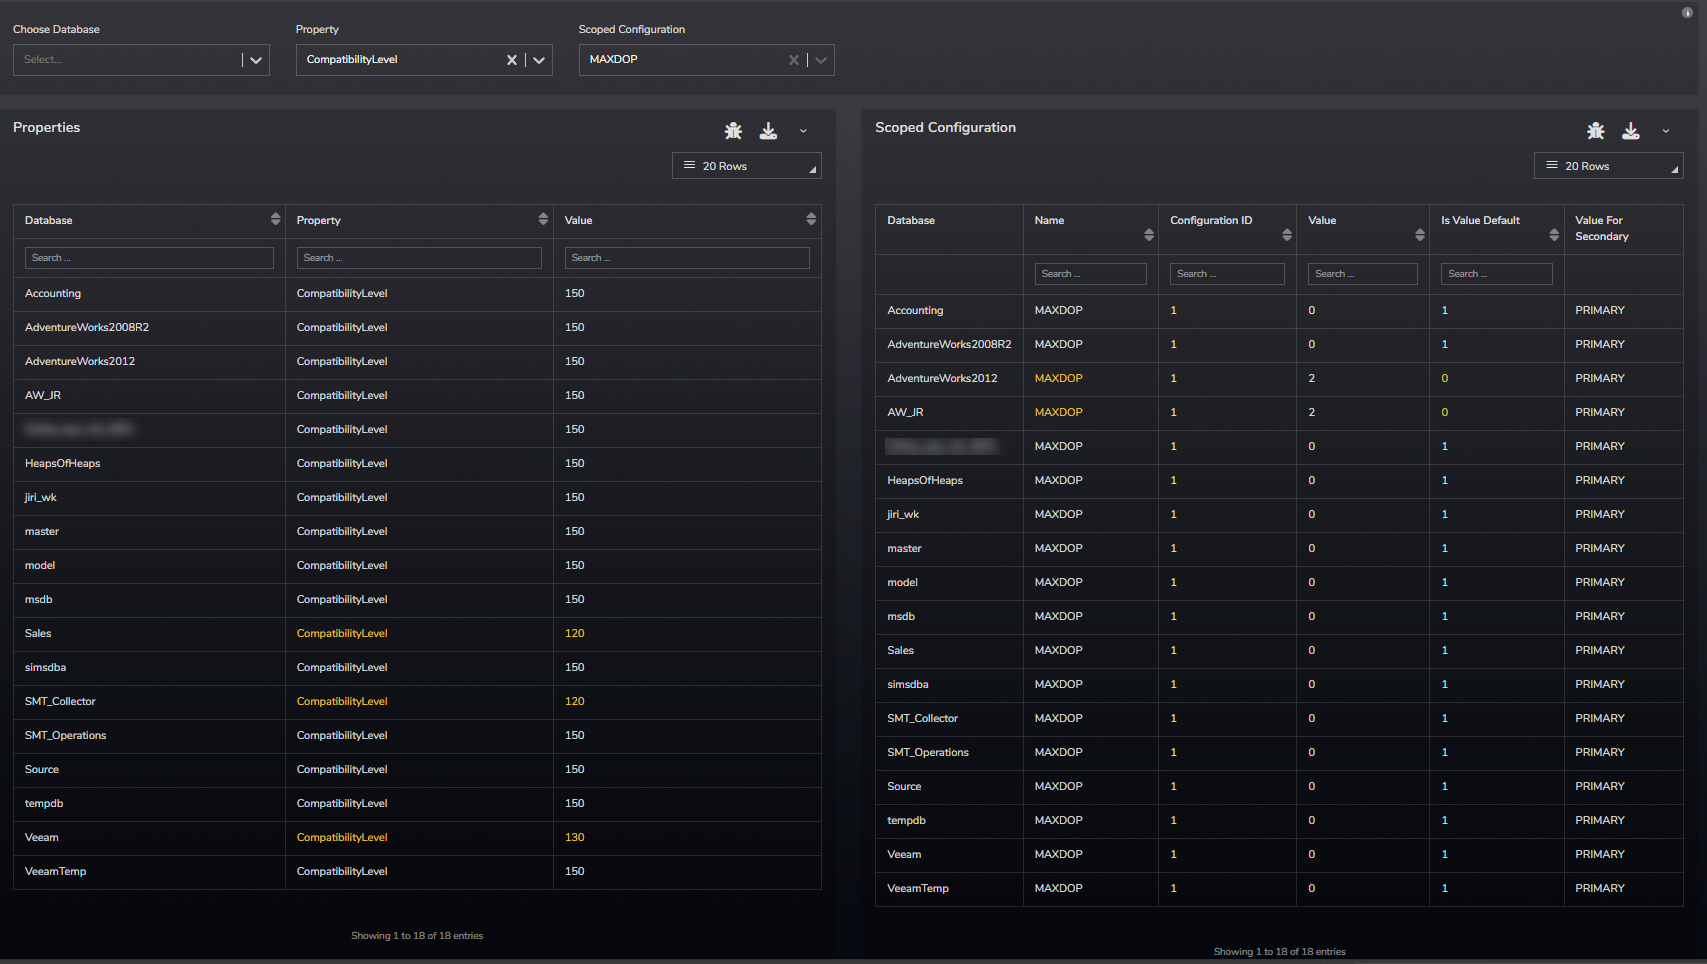
The Instance Info Report now aggregates all key server settings in one place with a new, intuitive color-coding system:
- Blue: Default settings
- Red: Configurations changed to incorrect values
- Yellow: Values that differ from the defaults
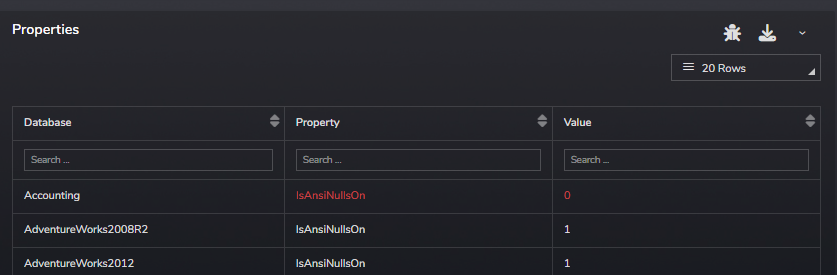
In addition, database-scoped configurations and database options have been integrated into the report, along with new KPIs for database availability and backup management, providing you with a comprehensive view of your system settings.
Tuning Notes and Reporting Overhaul
Enhancements include the addition of a Ticket ID attribute in the query hash report, which lets you quickly link tuning notes to specific issues. Tuning notes now automatically save the associated query plan and statement, reducing errors caused by updates in the query plan data.
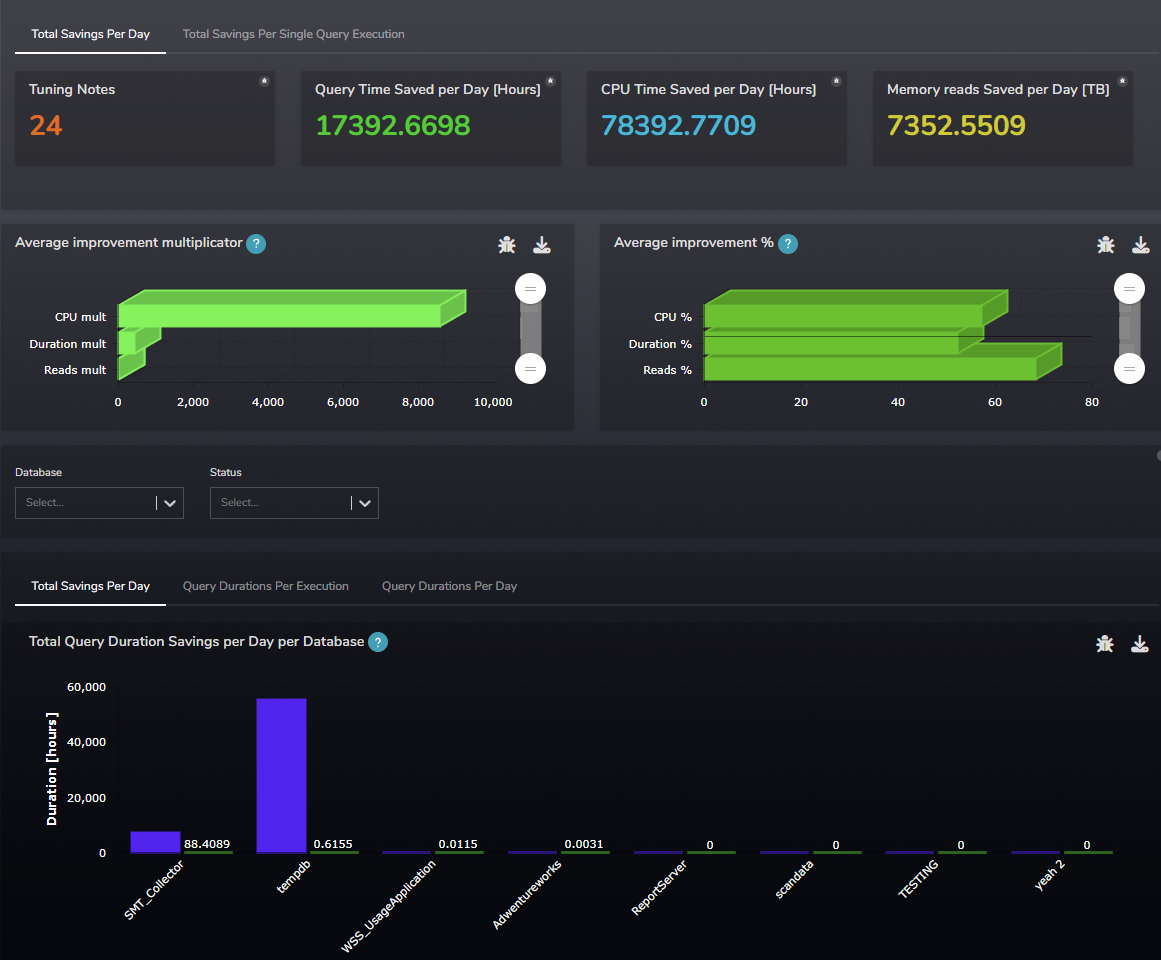
We’ve also improved the granularity of CPU and Duration metrics—from 1 ms to 0.0001 ms—and introduced new graphical elements such as total savings per day, per query execution, and improvements in logical reads. These changes give you deeper insights into the impact of your tuning efforts and strengthen your data for stakeholder negotiations.
Other New Features
Enhanced Check Parameter Editor
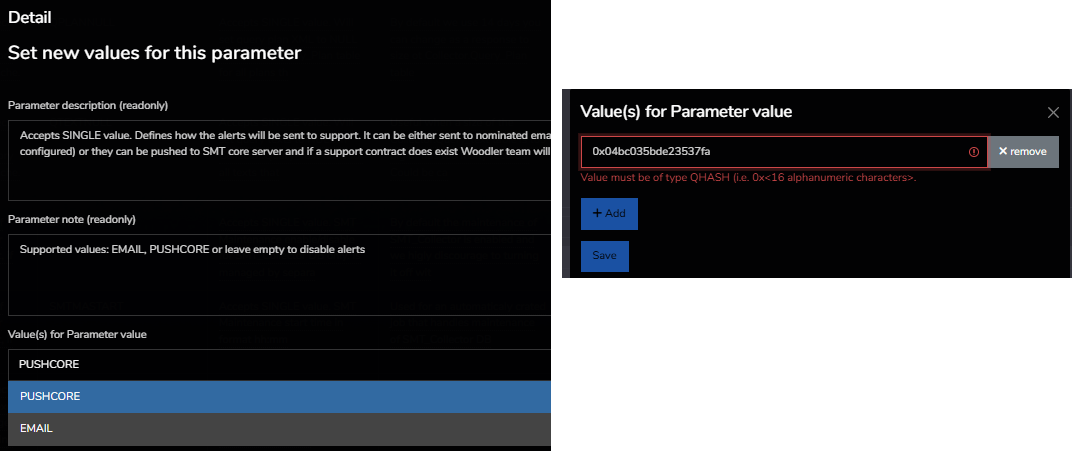
The check parameter editor now supports parameter types and validation. For example, when listing databases, only valid entries are accepted, ensuring that meaningless strings cannot be entered. This validation extends to other parameters, such as query hashes, by enforcing correct formats and limiting input where only one value is permitted.
Improved Resource Governor Report
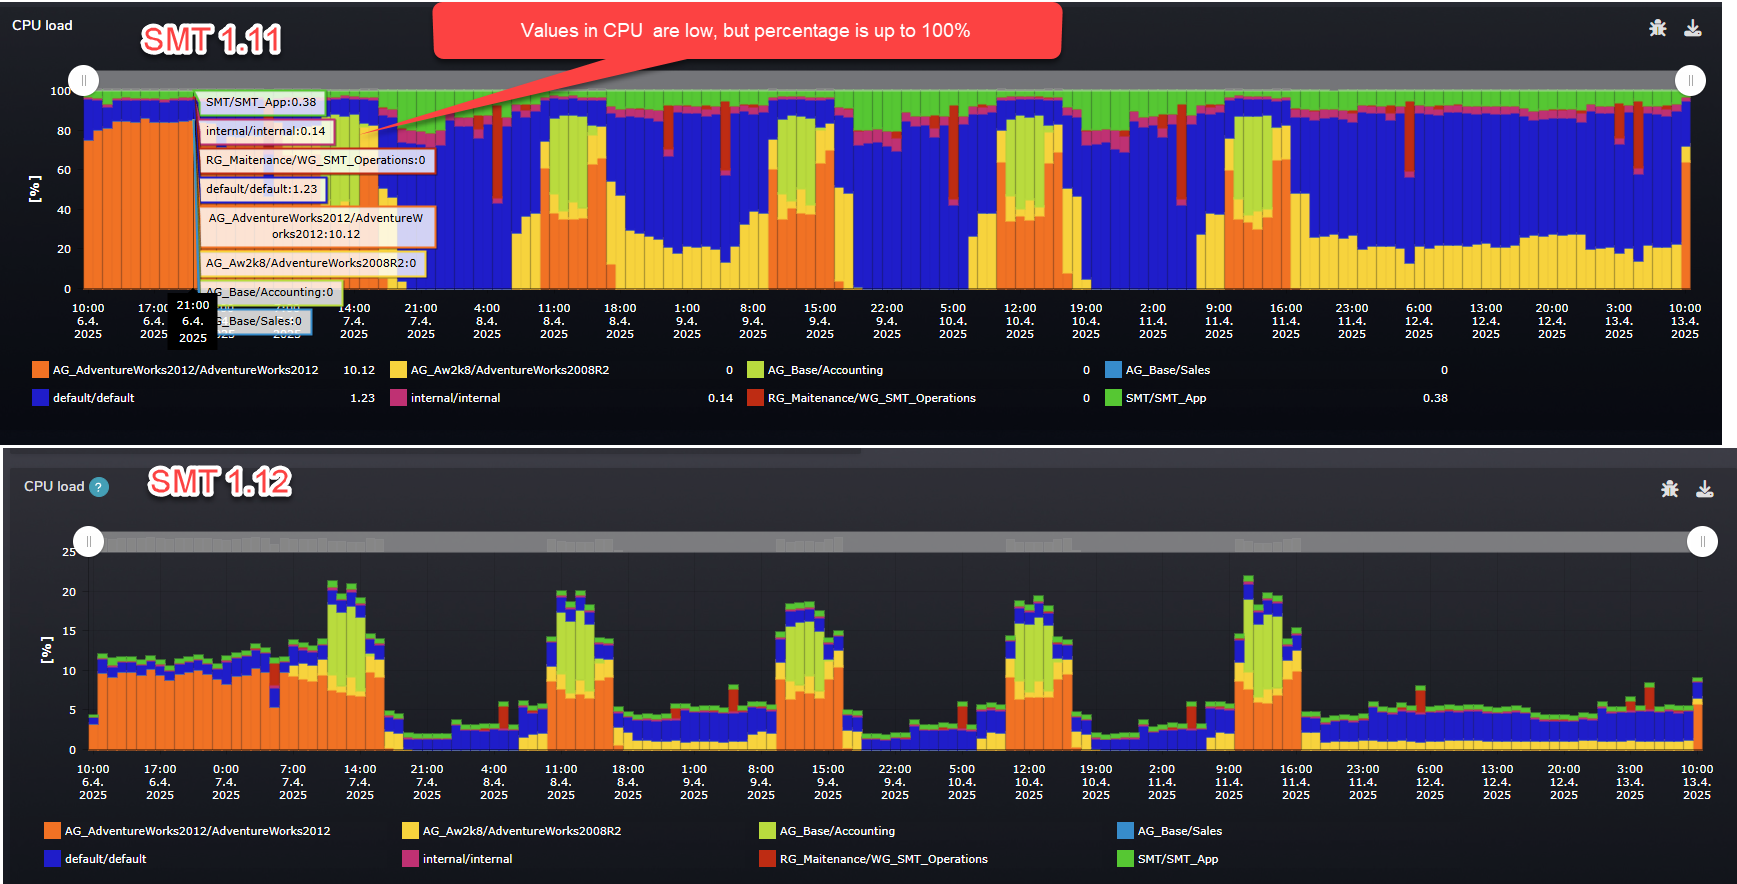
Previously, the Resource Governor report displayed CPU usage per workload group based solely on used CPU seconds, without factoring in total CPU capacity. The new implementation calculates CPU usage as a percentage of the total available CPU time—computed based on the number of server cores and the sample size.
For instance, in a 5-minute interval on a 4-core server (yielding 1,800 seconds of total CPU time), the report now displays a more realistic breakdown, such as Group A using 55.5% and Group B using 11.1%.
Maintenance Reports Enhancements
Maintenance reports now include a filter option that works with data from a specific table. We’ve also renamed several tabs for clearer content alignment and added a direct link from the Overview to the Detail report for easier navigation.
Additional Improvements
- The aggregated graph for Query Store Waits now informs users if the Query Store is not enabled, indicating why no data is available.
- The time picker’s “Now” button has been renamed to “Until Now” to better reflect its functionality.
- The CPU & Task Handling report now displays total values per interval instead of just the maximum per scheduler.
Bug Fixes
- AG Performance and Summary Reports: Addressed a performance degradation issue in environments with multiple AGs and hundreds of databases. Reporting performance has been improved, filtering on graphs has been simplified, and an “Others” category has been introduced for improved readability when displaying multiple low values.
- TempDB Contention Events Report: Fixed a bug that limited the length of resource descriptions.
- SMT Query Hash Search: Resolved the issue where no results were displayed during query hash searches.
- Sparklines for Volatility: Enhanced the sparklines to make significant value changes more apparent.
- Storage Performance Reports: Fixed issues that previously resulted in incorrect results in edge cases.
- Memory Buffer Pool Report: Resolved the "no data" error that occurred when the “month” option was selected alongside “until now.”
- Error Handling in Query Plan Wait Details Report: Improved error handling now properly reports when the Query Store is not enabled.
- Spinlocks/Latches Report: Fixed a bug where the report always displayed the full selected interval even when no data were present. Additionally, issues with data samples after midnight for the “hour” interval have been corrected.
- Storage Performance Status Message: Corrected the status message display, ensuring that values shown are accurate in all cases.
We are confident that the enhancements, new features, and bug fixes in SMT 1.12.0 will greatly improve your SQL Server tuning experience. Thank you for choosing Woodler, and we look forward to your feedback on these improvements.
Sincerely,
The Woodler Team