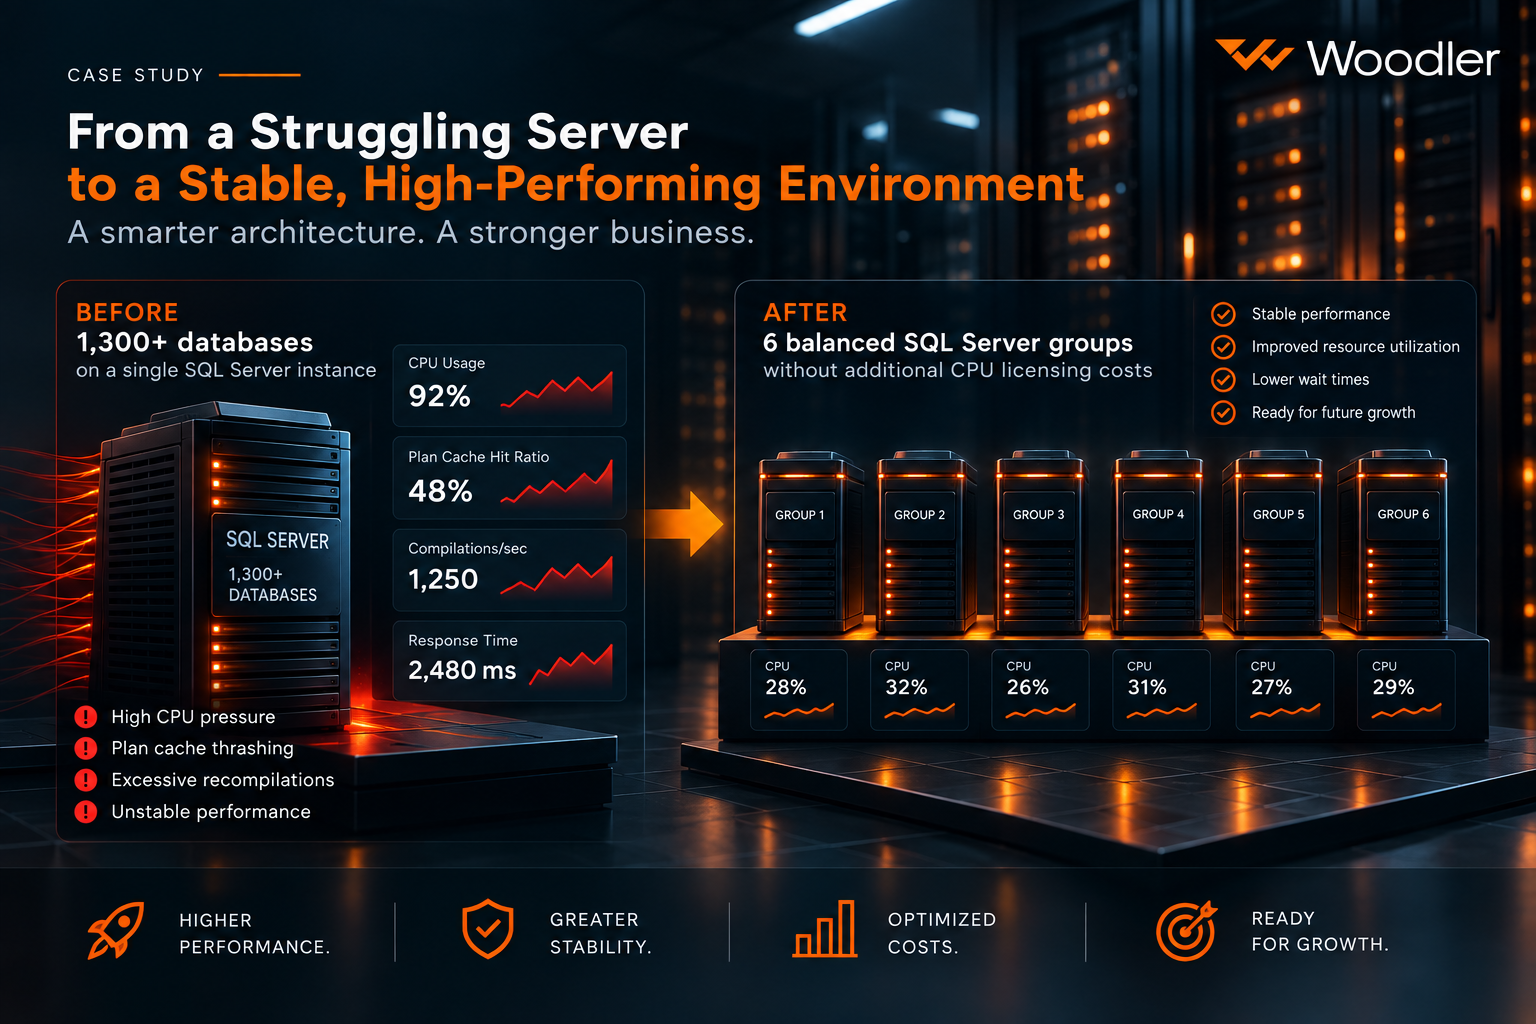
Stabilizing 1,300+ Databases Without Additional CPU Licensing Costs
Using load testing to uncover plan cache fragmentation and restore stable performance in a large multitenant ERP environment.
Client: Large consulting and accounting company
Industry: B2B financial and enterprise resource planning (ERP) systems
Technologies: Microsoft SQL Server, SQL Server Distributed Replay
Environment: Production (on-premises failover cluster)
Primary Challenge: Elimination of unpredictable response time spikes and maximum CPU utilization during morning peak hours.
1.The Challenge
The client operated a large multitenant ERP platform on Microsoft SQL Server, with more than 1,300 separate customer databases running on a single SQL Server instance.
During the morning peak, system performance became unpredictable and response times increased significantly. CPU usage regularly reached maximum capacity, but standard monitoring did not show any clearly problematic or poorly written queries. Traditional tuning efforts, such as index improvements and query rewrites, provided only limited benefit.
The goal was to identify the hidden bottleneck without affecting the production environment and to define a practical, data-based approach to stabilizing the platform.
2.The Solution
To reproduce production behavior safely, we designed a load-testing approach using SQL Server Distributed Replay. The work was completed in four phases:
Phase 1: Peak period analysis and trace capture
Using four weeks of historical monitoring data, we identified the most critical performance window: Tuesdays from 9:00 AM to 11:00 AM. During that period, automated SQL Agent jobs captured a production workload trace for replay testing.
Phase 2: Test environment setup and isolation
We prepared a dedicated 32-core server with an isolated SQL Server instance. This allowed us to test the workload under controlled conditions and produce reliable results for architecture decisions.
- Matching data footprint: We copied the logical and storage layout for 501 client databases so that I/O behavior closely matched production.
- Controlled parallelism stress: We intentionally used a more aggressive MAXDOP setting to create a controlled high-load scenario and observe CPU scheduling and worker thread behavior under pressure.
Phase 3: Two-stage load testing
To measure the effect of database density on the SQL Server instance, we ran two separate replay scenarios:
- Replay A (single database): The captured workload was replayed against one isolated database. This database was the central production database containing the main business logic.
- Replay B (multi-database): The same workload was replayed against that same core database, but with 500 additional client databases attached to the instance.
Phase 4: Comparative performance analysis
We compared performance data from both replay scenarios in a Power BI report and validated the findings against the production baseline.
3.Key Findings
The analysis of execution behavior and wait statistics revealed three important findings:
- Plan cache fragmentation: On the production instance with 1,300+ databases, fewer than 10% of databases (around 121) were able to keep execution plans in cache at the same time. Plans were constantly being evicted and re-created.
- CPU-heavy recompilation: In the single-database replay, plans stayed in memory much longer. In production, however, the server had to perform roughly three times more compilations per second (20–30 per second versus fewer than 10 in the test environment), which created unnecessary CPU pressure.
- Unstable query response times: The same queries showed large differences in execution time. Because CPU scheduling was saturated in production, processes waited much longer for CPU time. Signal waits were about 4% in production compared with less than 1% in the isolated test.
Root cause: The main issue was not a lack of hardware capacity. The real problem was the SQL Server instance architecture. Too many databases were competing for limited plan cache space, causing cache thrashing and reducing CPU efficiency.
4. Results and Impact
Based on the evidence, we recommended an architectural change instead of further local query or index tuning.
Using a custom optimization approach, the 1,300+ databases were divided into six balanced groups based on business logic and data footprint. This distributed memory demand more evenly across the cluster and reduced contention.
Business and technical outcomes:
- Multi-instance cluster deployment: Distributing databases across separate SQL Server instances removed the plan cache contention seen on the original shared instance.
- Lower CPU wait pressure: Reducing plan cache churn lowered unnecessary compilations, decreased signal waits, and stabilized response times during the morning peak.
- Avoided licensing costs: The client achieved stable performance without buying additional CPU core licenses. The issue was resolved through architecture changes and deployment of a new storage array rather than a processor upgrade.
5.Conclusion
This case study highlights an important lesson for large multitenant environments: high CPU usage does not always mean poor SQL code or insufficient hardware.
In high-density multi-database environments, performance can be limited by how efficiently execution plans are stored and reused. In this case, simply adding more CPU capacity or purchasing more licenses would have increased cost without addressing the real cause.
By combining realistic load testing with detailed wait-statistics analysis, we turned a difficult performance problem into a clear architectural decision. The resulting sharding strategy and multi-instance failover cluster improved long-term stability, protected existing infrastructure investment, and created a stronger foundation for future growth.