Dear SMT users,
With the new year we have a new SMT version available. So let me jump to the details of the included changes.
Reports
New
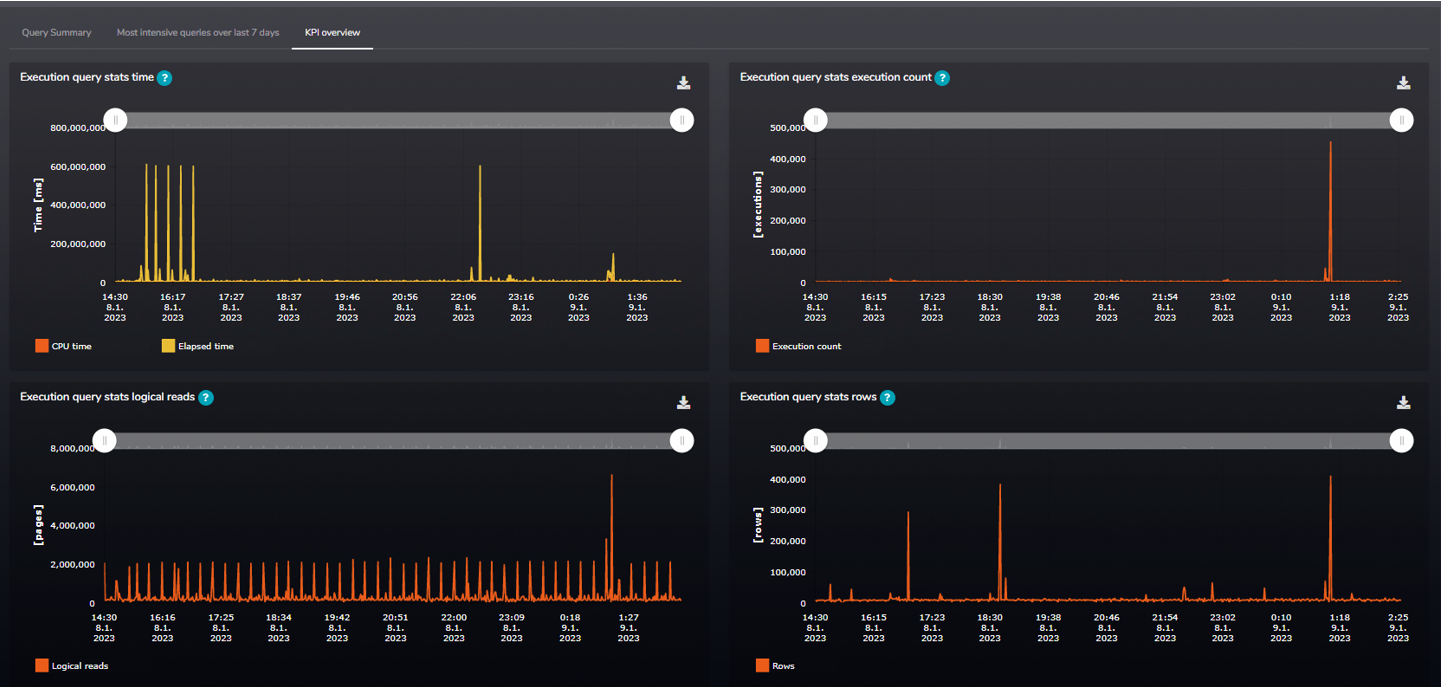
- Queries summary does have a new tab for “KPI overview” this is a new collection with reports to show you total values for all queries in server cache to show you overall server performance on a timeline. You may use this metric to gauge overall query response time on the server. If these graphs change dramatically from the trend, it will clearly show that a regression in query performance has occurred.
Figure 1: Queries KPI overview
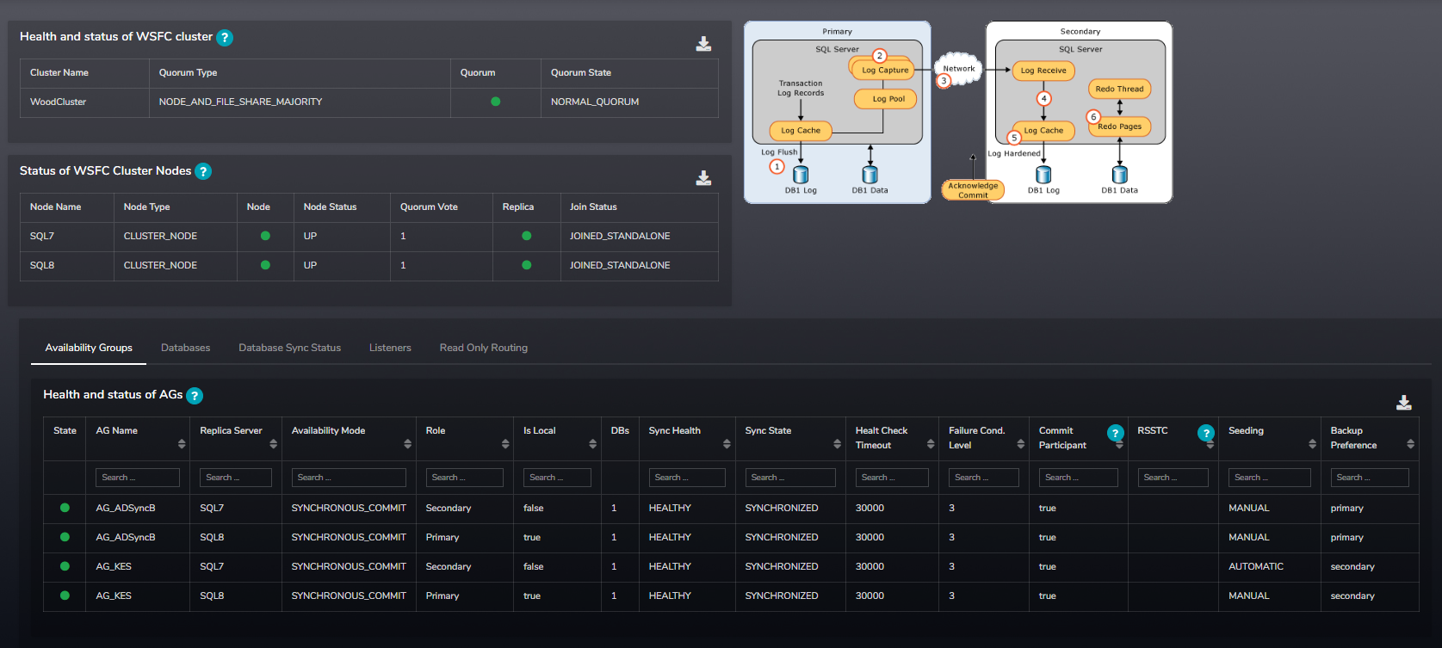
- We have created a new set of two reports about the current status and performance of your availability groups which includes total values but also over time view of its performance. You are going to find them under the already existing Always On category. By using these reports, you could evaluate the performance of your Always On topology and find bottlenecks on either Primary, Secondary Replica or a transport level.
Figure 2: Always On report
Updated
- Waiting tasks detail now contains a new view – “Summary per query” to help you identify most frequent queries that do wait the most often or for the longest time.
- Temp DB overview report has been updated to report PFS, GAM and SGAM contention events accurately, a new filter has been also added to see only these events unless you want to see them all.
- Index usage on a list and detail level now contains valuable information about page splits.
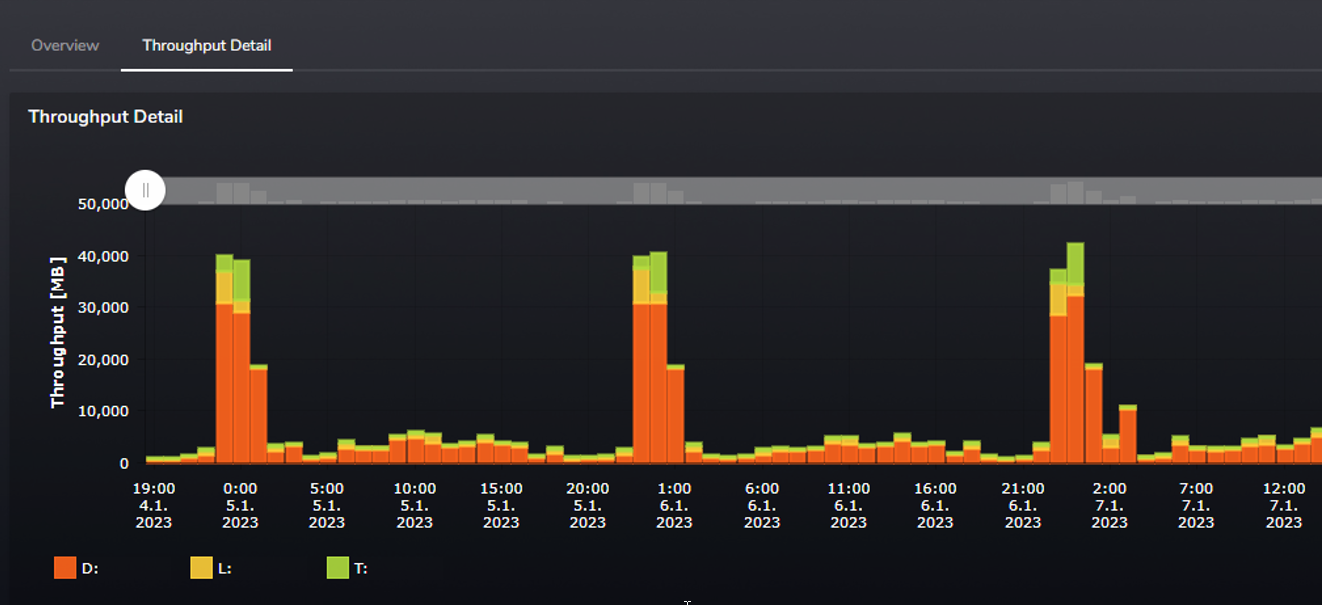
- Storage performance got a new chart to help you identify databases and files contributing the most to the storage load in an easier way. You can use this view to drill down from volume points down to databases and files to see where the biggest throughput happened.
Figure 3: Storage throughput chart
Generic changes
- We moved all options to control and view SMT collection and reporting under the SMT settings menu item. Now you could evaluate all collection statistics & performance of SMT here.
- With changes on the customer portal, we made changes to SMT itself as well to make use of new more detailed security options and also to show a group name to which the monitored instance belongs. Soon this will be set through the customer portal only.
- In the app itself we added an option to show and format XML data for e.g.: locks in block chain reports, added some features that will be used in next versions e.g.: select boxes in modal windows used for user’s input.
- We had to update the auto refresh feature to make sure the underlying data won’t refresh when it is not necessary to avoid overloading server where we query data from.
- We made enhancements to alerts of server high severity errors, to have a better control over priorities of these alerts, be able to exclude errors and also to report events when SQL server generated a dump file.
At the end of this post, on behalf of the whole SMT dev team, let me wish you a happy new year and all the best for 2023.
Regards,
Jiri Dolezalek