There are usually multiple ways how to provide a view of a set of data as a report, involving decisions like; keep it easy to read, interpret the relationships between multiple figures in the correct way and to show user as much information as possible at the same time. This often leads to situations when we have slightly more data collected than we are able to show in reports. For us the goal is not only to be familiar with all the existing reports but more importantly to be aware of all the data that we collect and be ready to provide different views if required.
We experienced this recently when a customer has been planning upgrade of their system – delivered by a 3rd party company and because in the past months an index tuning has been performed on the system there was a concern that these changes might get lost or there will be redundant indexes after the upgrade.
The first idea was that we will have to go through all tickets and emails on our and customer side to try to cover all index changes in the past 6 months, luckily SMT does collect index definitions and their changes and it reports them on the index level, which is quite a deep level, not used on a daily basis. Instead of all the manual work, we put together an ad-hoc report to show all changes for a particular database since a specific date. This saved a lot of time to us and customers and allow us to see all the changes in a single list, additionally, once the system will be upgraded, we will be able to run the report again and see if there were any changes around those that were done to improve performance of the system.
From the data we were able to get full set of information about the index, which allows us to create a script to create the index (or DROP) and to show not only the current values but also the previous and new state e.g. for Key columns.
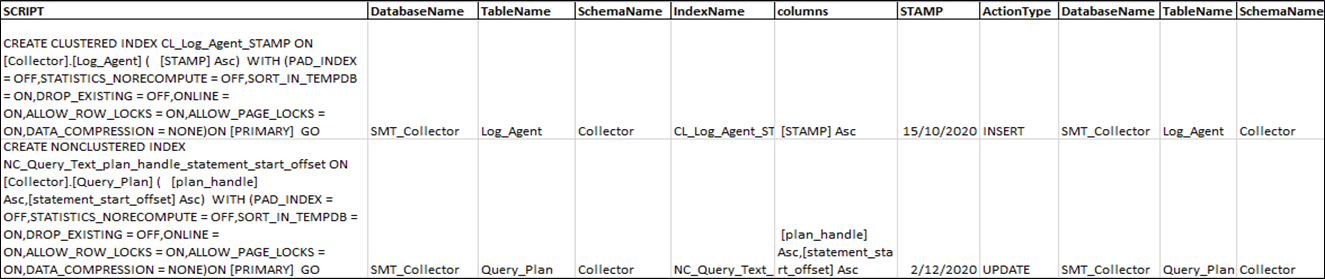
Figure 1: List on index changes including script to re-create, related objects and columns
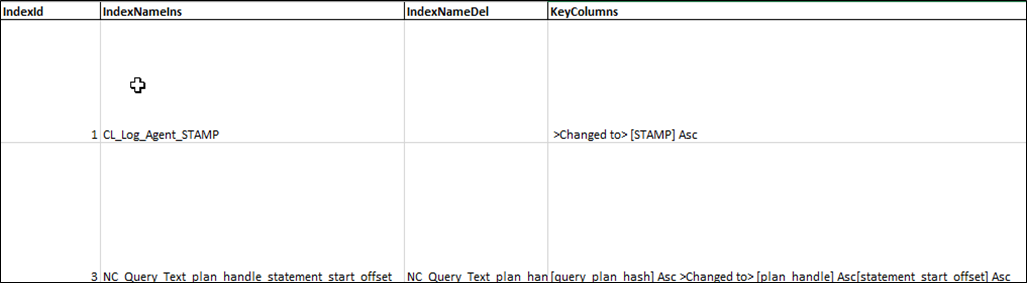
Figure 2: Provide detail of Key columns changes [Before change] >Changed to> [New state]

Figure 3: Some of the index parameters like FILL FACTOR, PAD INDEX, Locks or Compression – we have them all.
By running standard SMT Index reports after the upgrade we will be able to see if there were any other changes, which would mean that some indexes are not used or used less or because of a new workload we will be able to see if there are any new index recommendations.
This is a story of how we respond to our customers’ needs to make their life easier, this one-off report will be added to SMT and will extend the portfolio of index reports, which is a common approach of extending the current set of reports – based on the users’ and customers’ needs. We do not add “useless” reports just because we can, we add them because there will be a benefit of having them in SMT and because all of them are based on our experience “in the field”.
Regards,
Jiri Dolezalek