SMT 00.5.34 Released!
by Michal Tinthofer on 18/10/2017Today we introduce to you another patch which was focused on several “quality of life “improvements. Let's have a look!
Read moreHello Everyone!
after a Christmas and New Year vacation, we are back with the new release of SMT. This time much smaller, but earlier than usual.
Major Changes:
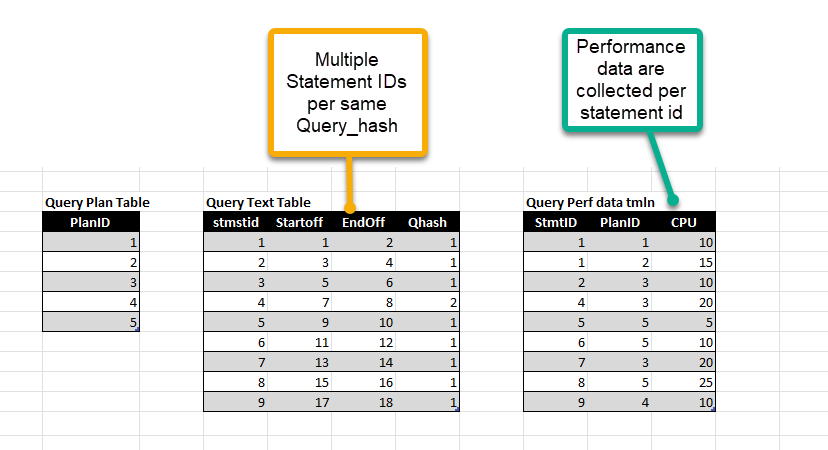
Query Performance collection. After the last update of the query collection in the 1.10 release we identified several issues in the new approach that we needed to fix. A major challenge was the way how we aggregate the query performance records during collection. In the previous version, we used Query_hash as a main identification of specific queries together with its statement offset attributes to define query uniqueness. The following rough example shows such as situation. 
In the picture, you may see several statement ID records for the same query hash just because the statement offset was different. This difference could be caused by several factors such as the different position of the code in the SQL module, dynamically constructed ad hoc queries containing specific literals causing command text length to change, and so on. Basically, we reported any change in code position as a distinct query with its own ID.
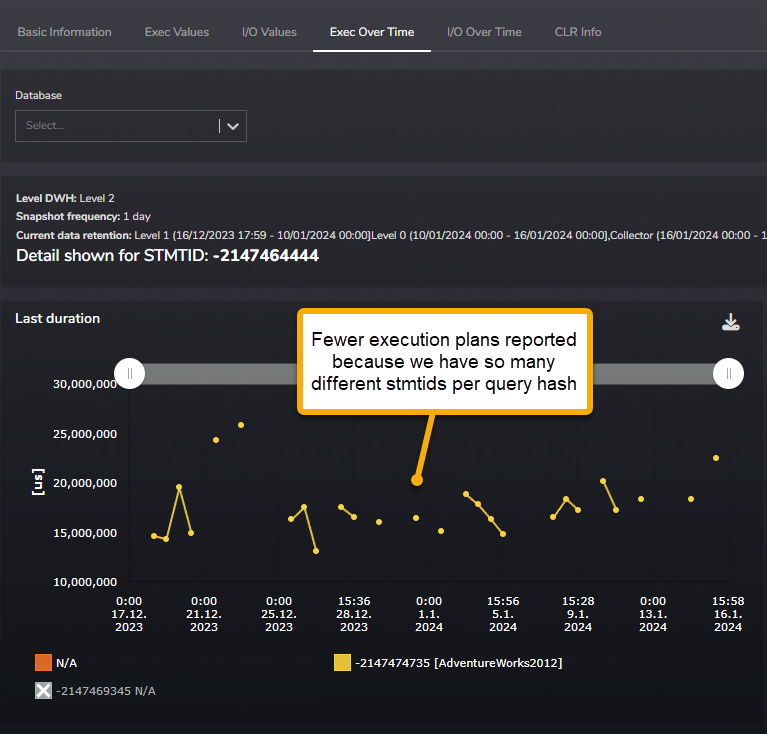
This has some drawbacks. One of them was less data to correlate in over time query statistics.

Another issue is collection cost which increased storage requirements due to this new collection logic and multiple similar execution plans and query texts used across different statement IDs.
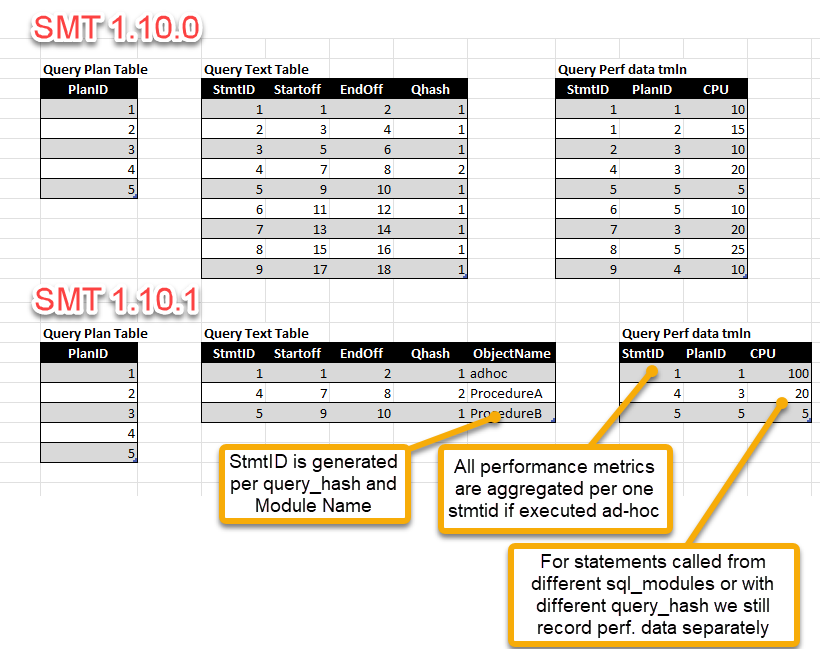
Our new solution handles all of the issues reported. New logic still uses Query_hash as the main identification for the query, but we introduce a new attribute called ObjectName for aggregation instead of statement offsets. The ObjectName could have several different values:
This new logic allows for more concentrated aggregation, producing more meaningful collection results where users could see data in more aggregated form, saving storage space and improving reporting results. The following example describes this:
.

As you can see, the results are significant, and we already see a positive impact on SMT database sizes across our customers. But, we need to mention some other aspects of this change.
In SMT 1.10.1:
You will no longer be able to track specific execution of the statement based on offset attributes. Data will always be aggregated under the same query_hash and object name (or with text "Ad-Hoc/Prepared" in case of batch requests). You will need to look more at the min/max values of query performance data and not rely only on averages since they will contain more queries executed from different batches and have different performance characteristics.
Since we have SQL module names directly attached to the specific statement IDs, we retain the same reporting performance for the code called from those modules as in SMT 1.10.0.
What we are planning to add, is the correlation to procedure and trigger reports to take advantage of this new relation between query performance and module performance data on the ObjectName attribute.
We hope you will enjoy this new concept and in case of any notes or issues/ideas feel free to get in touch with us!
New Query Collection Parameter QC_MINCPU:
The new default value for QTEXTNULL parameter:
Let's start with an explanation of what this parameter does. Using this parameter, we control how much SMT keeps all batch texts for everything executed in the last X days. Filtered texts are not affected by this parameter. This is useful when the size of the Collector.Query_text table is too big or has too many records. This could be caused by the low parametrization of statements on the server.
Since this release, we have enabled the automatic cleanup of batch text from queries which are not been collected in the last 31 days.
Minor Changes:
We have made some changes to be backward compatible with SMT installation on SQL 2012 as in good old times. Yes, we still finding customers using old SQL Servers.
On behalf of the SMT dev and support team I hope you will enjoy the new features and will continue to have a great experience with SMT.
Regards,
Michal
Michal Tinthofer is the face of the Woodler company which (as he does), is fully committed to complete support of Microsoft SQL Server products to its customers. He often acts as a database architect, performance tuner, administrator, SQL Server monitoring developer (Woodler SMT) and, last but not least, a trainer of people who are developing their skills in this area. His current "Quest" is to help admins and developers to quickly and accurately identify issues related to their work and SQL Server runtime.
Today we introduce to you another patch which was focused on several “quality of life “improvements. Let's have a look!
Read moreThere are usually multiple ways how to provide a view of a set of data as a report, involving decisions like; keep it easy to read, interpret the relationships between multiple figures in the correct way and to show user as much information as possible at
Read moreWe are excited to announce the release of SMT 1.12.0. In this update, we have focused on refining existing features while introducing a new optional capability that could dramatically enhance the way you proactively tune your SQL Server with SMT.
Read more