SMT 1.13 Release Notes – September Update
Greetings to the SMT community,
As we finalize the upcoming release, we want to share with you what is coming. This update will be deployed to your server in September, and you will be notified through the SMT notification framework as usual.
New Features
Replication Performance Monitor
The flagship feature of this release provides DBAs with a powerful new tool to analyze replication configuration and performance.
- View all replication properties in one place: Distributor status, Publications, Articles, and Subscribers.
- Monitor distributor and log reader performance together with undelivered command volumes per subscription.
- Quickly identify problematic replication performance issues.
- Analyze detailed Replication Event Logs for troubleshooting.
Column Statistics Detail Report
- Review the histogram and properties of every column statistic on your instance.
- Use a built-in calculator to pre-compute server estimations based on custom column values.
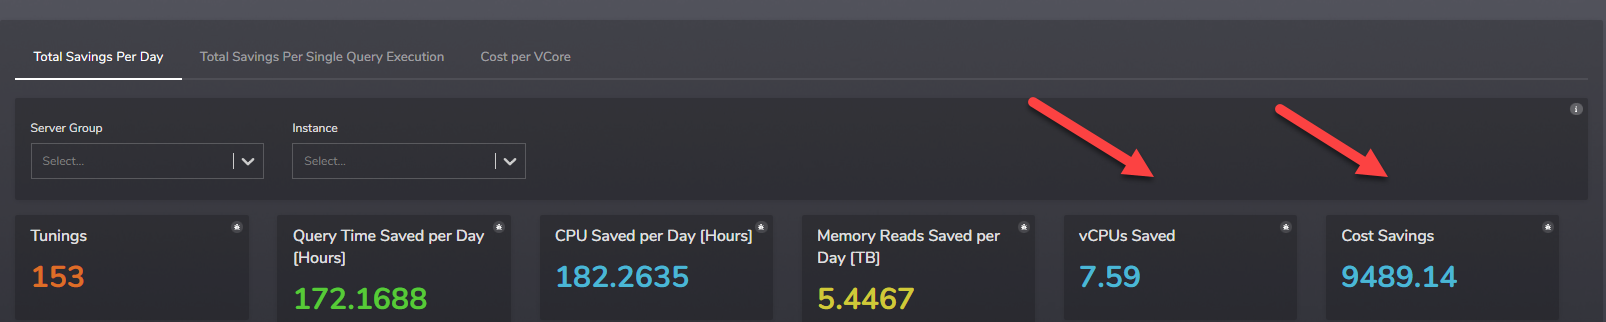
Tuning Notes – Savings in vCores
- Daily savings are now also displayed as vCores saved.
- Define your own vCore cost, and SMT will compute the total savings achieved through tuning.
- Filter results by server group or specific instance.
Index Operations Report
New report provides detailed insights into index operations across your environment. All possible metrics, including operational, usage, and index properties, are now available for filtering and displaying top indexes in the selected property across the entire instance or a specific database/table. There are more than 50+ attributes to choose from. We believe this is the ultimate tool when you need to identify any specifics about your indexes.
A few scenarios where it’s useful:
- Identify which indexes are read most, and by which operations (seeks, scans, key lookups).
- Find indexes using a specific compression type.
- See which indexes use partitioning and on which partition scheme.
- Map indexes to their filegroups.
- Spot indexes with the most page splits (leaf vs. intermediate).
- Locate where lock escalations occur most often.
- Surface the longest/most frequently latched indexes.
- Find indexes that disallow page locks or are most row-locked.
- List indexes that are unique or enforced by constraints.
- Report HEAPs with the most forwarded fetches.
- Show hypothetical or disabled indexes.
- List indexes by type (including NONCLUSTERED HASH).
- Find statistics with NORECOMPUTE set.
- See most recently created and modified indexes.
Quality-of-Life Improvements
- Instance Info report now also shows descriptions for enabled trace flags
- Instance info report now showing all IP addresses on which SQL Server instances listen
- Instance info report now provides information on which SQL Server build you are using and a URL link to download the latest cumulative update.
- Tuning notes and detail reporting now show Logical reads using a logarithmic function to better visualize and compare the volume with other metrics like Elapsed time and CPU.
- Query Hash report now shows the object schema name
- DB file distribution report now by default shows files from all databases and we added paging to the table, preventing excessive volume of rows from overwhelming the browser.
- Visuals and UX: We have changed colors on table data bars not to use Red and Yellow; we want those colors to clearly describe only critical issues that need to be solved, and yellow for things that require your attention. The rest of the colors will be more into blue color shades, describing the information messages. In future releases, we will continue with graph colors.
- Added a paged table to the Tuning Notes for tuning records
- Instance Info report > Overview of databases now shows a new column "Encrypted" describing if TDE was enabled on the database.
- In the report Query Hash Detail, we included a search also on Query_hash_signed, which you may get from your XE sessions. Before SMT 1.13 you had to have the exact queryhash in 0x..... format.
- When configuring check parameters, you will have an option to align them to base values, the same as you have in check collection configuration.
- Improved the syntax of missing indexes to be more accurate
- When choosing a table in the Table Size report, the filter will provide a sorted result set.
- Implemented helper procedure directly into SMT Execution plan report (Test Batch tab), giving you preformatted text of query ready for execution and testing with the sp_executesql procedure.
- Execution Plan report now includes visual plan representation (this is currently a preview feature; further development will be needed here)
Bug Fixes
- Fixed Average CPU reported in the Query Hash Detail report incorrectly reported as in seconds, but it was actually µs.
- Small fixes in how parameters are reported on instances with case-sensitive system collation.
- Fixed check for Query Store availability failing in Execution Plan → Plan Waits.
- Optimized Query Store reporting, which was using prevention for runaway queries too aggressively.
- Fixed Storage Performance Detail report: The Total latency graph did not reflect the correct MAXIMUM value. We have fixed a minor bug globally that prevented the first sample of the next day from displaying correctly when selecting a full-day interval without overlapping into the next/previous day.
- Fixed bug showing only the latest top 50 tuning notes in the Tuning Notes summary table.
- Resolved a challenge where the AlwaysOn Current Status report on the primary replica would not show any statistics for secondaries.
- Memory report Internal Physical NUMA on graph Page Life Expectancy per NUMA node in some cases showed inconsistent data.
- We have made the database info in the Instance Info report compatible with Azure Managed Instance.
- Fixed in Queries > Execution Plan report: bug with LastPlan memory grant values not displayed.
- Fixed typos in Query Search tooltip.
- We now properly check if jobs ended successfully.
- Server Tuning – TuneIQ – Memory Arithmetic Overflow has been fixed on one check.
- Activity Monitor in Session Details will now link you to the correct instance for searching for a specific query hash.
- Minor fixes to the procedure and trigger statements in respective reports.
With this release, SMT continues to expand its monitoring, tuning, and reporting capabilities, helping you keep your SQL Servers optimized and under control.