SMT 1.14.1 Release Notes
SMT 1.14.1 brings another set of important improvements focused on deeper SQL Server performance analysis, execution plan troubleshooting, monitoring reliability, and overall reporting accuracy.
The highlights of this release are a completely new Memory Grants report with more precise SMT-native collection and the production release of our Graphical Execution Plan Explorer. We have also introduced several improvements across Topology Overview, blocking analysis, execution plans, Query A/B Testing, replication monitoring, and the SMT collection framework itself.
New Memory Grants Report
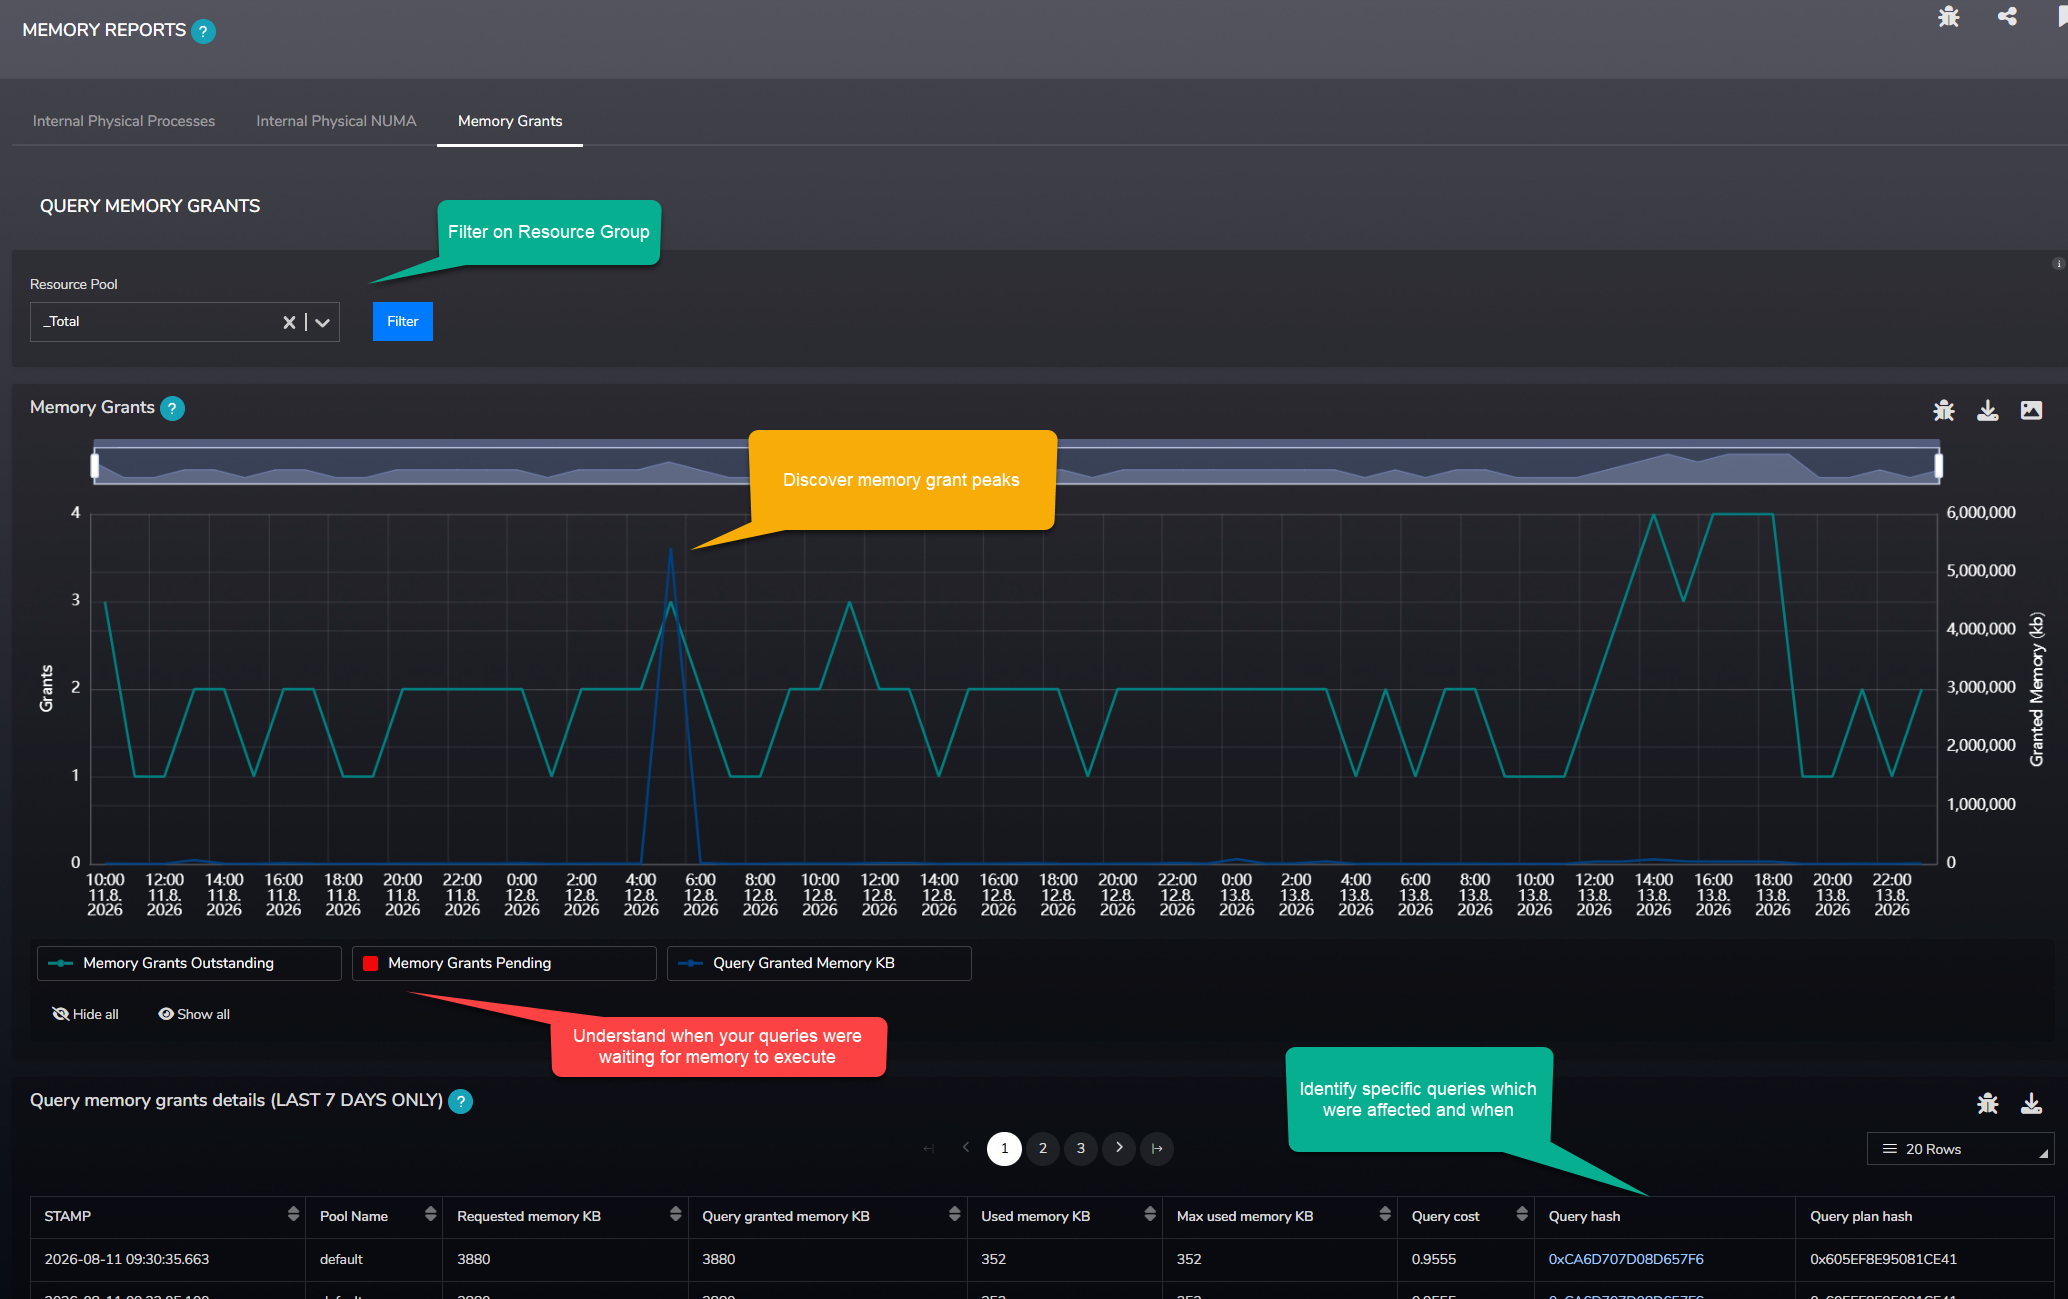
Memory grant problems are a common source of SQL Server performance issues. While investigating these scenarios, we identified cases where the standard performance counters for Memory Grants Pending and Memory Grants Outstanding did not provide sufficiently reliable information for detailed troubleshooting.
For SMT 1.14.1, we therefore introduced our own more precise Memory Grants collection and significantly expanded the amount of information available for analysis.
The new report is available under Memory > Internal Memory > Memory Grants.
- Monitor Memory Grants Pending and Memory Grants Outstanding using SMT's new collection logic.
- Analyze memory grants separately for individual Resource Governor resource groups.
- See the actual amount of query memory requested and granted.
- Identify queries that received memory grants as well as queries waiting for memory.
- Correlate memory grant peaks with the specific queries responsible for the workload.
- Use query hash and plan information to continue troubleshooting directly in SMT.
This makes it considerably easier to investigate memory grant pressure and understand whether queries are waiting for workspace memory, how much memory was granted, and which workload was responsible for the pressure at a specific point in time.
As part of this change, the previous Memory Grants chart was removed from the main Memory > Internal Memory page and replaced by the dedicated report containing the new, more detailed analysis.
Graphical Execution Plan Explorer Released to Production
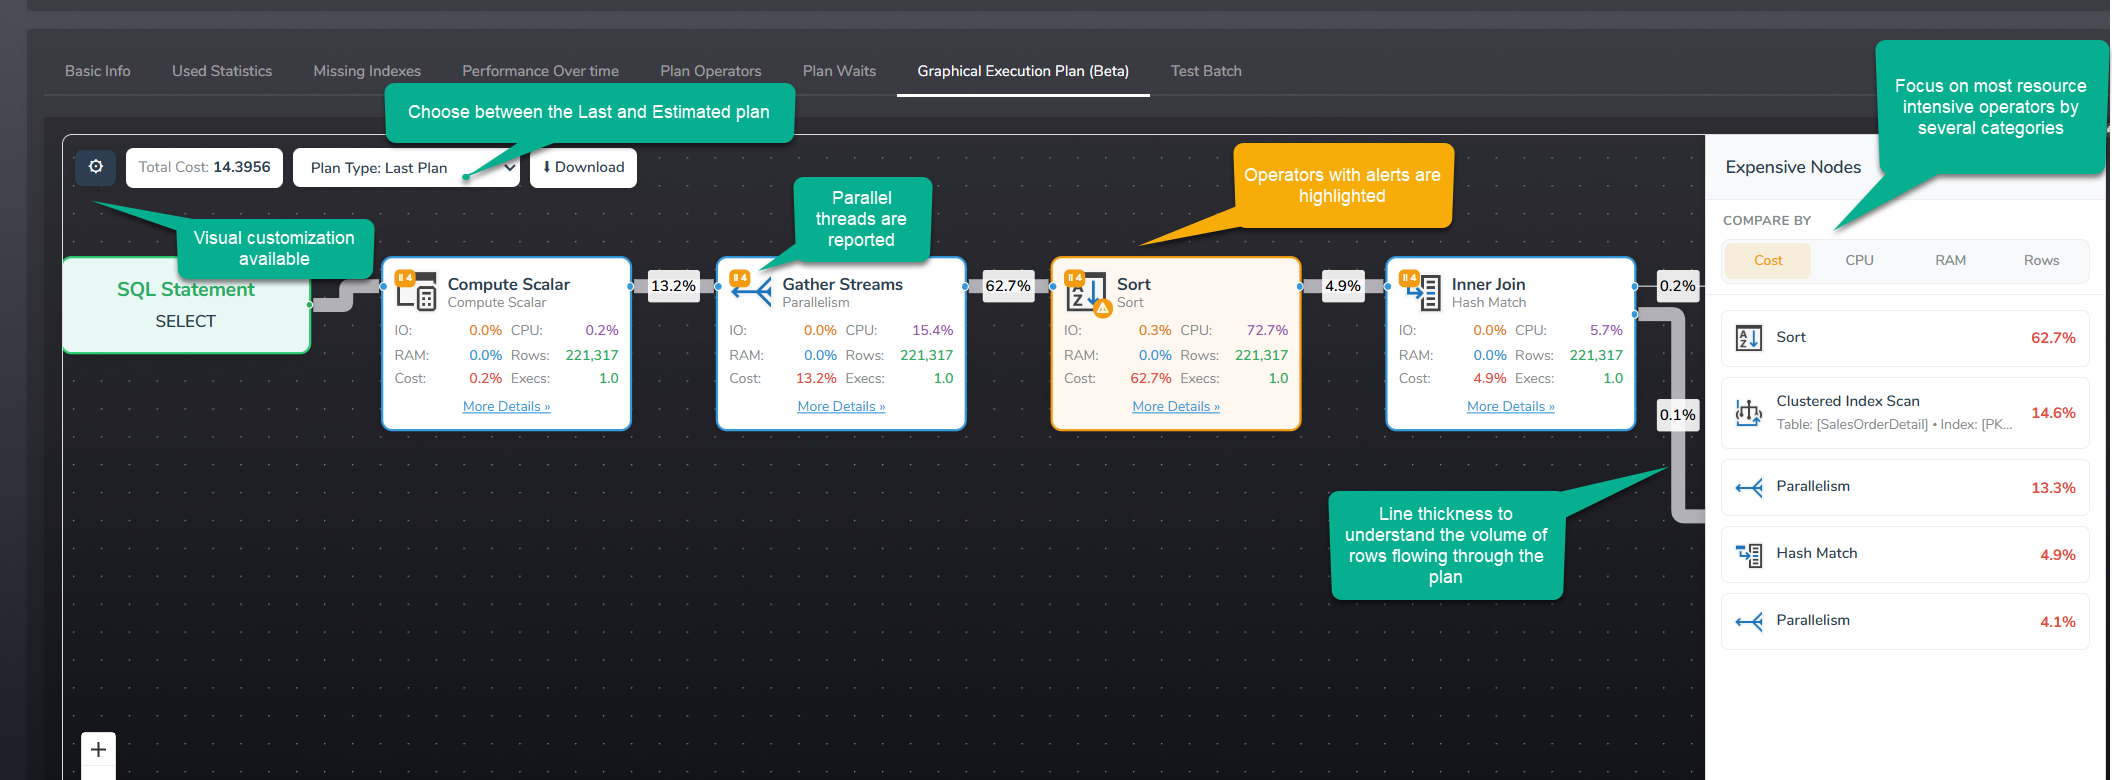
We are proud to announce that the Graphical Execution Plan Explorer has moved out of BETA and is now officially released for production use.
SMT 1.14.1 introduces several significant improvements to the Plan Explorer, making it easier to understand both the optimizer's original estimates and what actually happened when the query executed.
- Choose whether you want to analyze the Estimated Plan or the available Last Plan.
- Use the new focus bar to quickly identify the most relevant operators based on the selected attribute.
- Focus operators by categories such as cost, CPU, memory, and rows.
- See actual runtime values from the Last Plan directly inside operator information bubbles.
- Operators containing relevant warnings are highlighted to make potential problems easier to identify.
- Residual predicates are now highlighted in yellow in operator details.
- Parallel execution information is exposed directly in the plan visualization and operator details.
- The underlying Plan Explorer now supports multi-statement batches. For now, SMT displays the statement associated with the plan hash selected by the user.
New Row Accuracy Metric
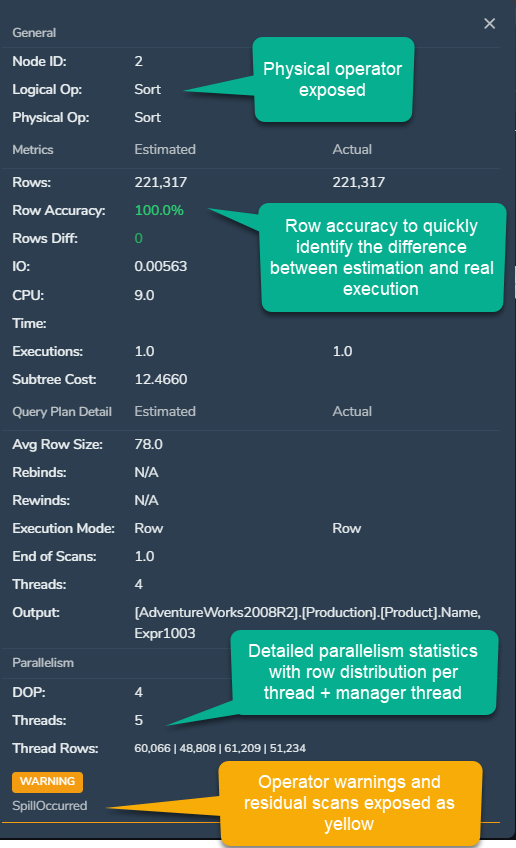
One of the useful additions to the production version of Plan Explorer is the new Row Accuracy attribute.
Row Accuracy compares SQL Server's estimated number of rows with the number of rows actually processed at runtime. This allows you to immediately see where the Query Optimizer significantly underestimated or overestimated the cardinality of an operation.
The metric is available only when SMT has actual execution statistics from a Last Plan and both the estimated and actual row values are available and non-zero. It is therefore not displayed for a purely Estimated Plan.
Large differences between estimated and actual row counts can be an important indicator when investigating cardinality estimation problems, outdated or insufficient statistics, parameter-sensitive workloads, and poor execution plan choices.
Feature Updates and Improvements
Topology Overview Online KPI
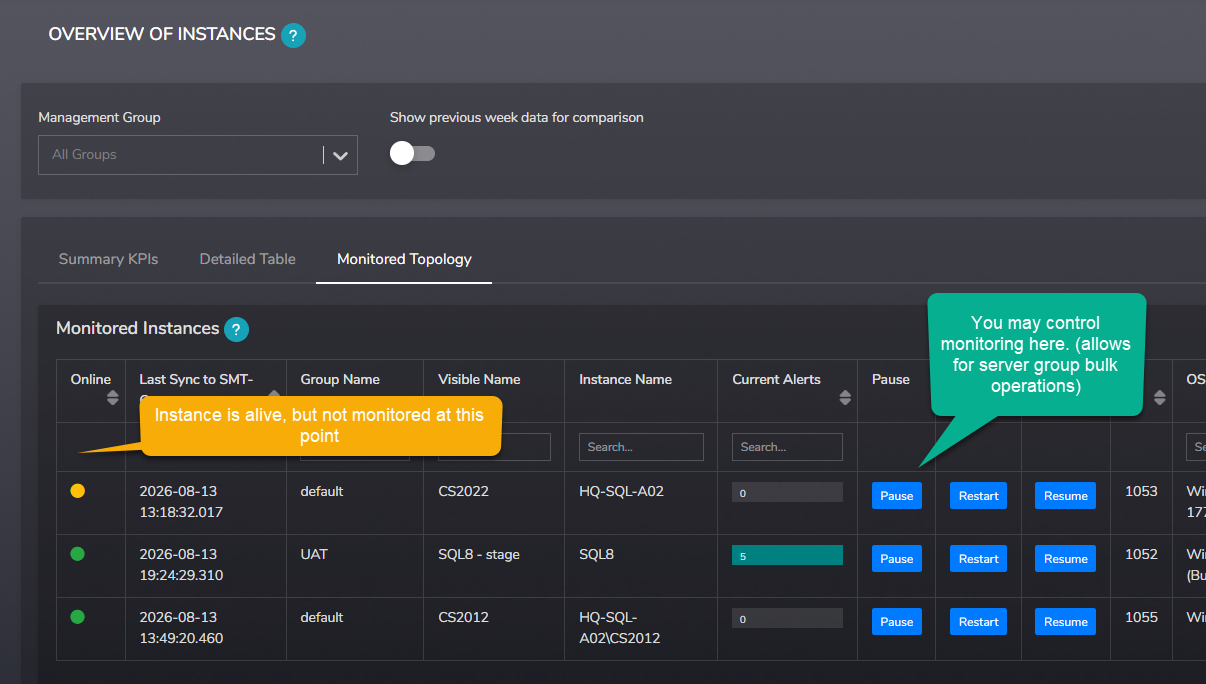
The Online KPI in Topology Overview has been synchronized with the monitoring-state logic introduced in the Monitored Topology tab in SMT 1.14.0.
Both the Detailed Table and Monitored Topology views now use the same logic, allowing administrators to distinguish between an unavailable SQL Server instance and a situation where the instance itself is available but SMT has not received fresh monitoring data.
- Green – the monitored SQL Server responds to queries within 60 seconds and SMT has collected fresh monitoring data within the last 60 seconds.
- Yellow – the monitored SQL Server did not respond within 60 seconds, or SMT has not collected new monitoring data within the last 60 seconds.
- Red – the monitored SQL Server does not respond to queries within 120 seconds.
Before SMT 1.14.0, the Online KPI was based primarily on whether SMT was receiving monitoring data. The updated logic also takes actual SQL Server availability into account, providing a more useful indication of what is happening on the monitored instance.
Blocking Report – Longest Block Duration
The blocking graph previously displayed the combined wait time of all blocked sessions and all collected occurrences. While useful for measuring the overall impact of blocking, this approach could make it difficult to understand how long the actual blocking situation lasted, as the values can be inflated.
The graph now reports the sum of Longest Block per session instead. This gives administrators a much clearer indication of the duration of the blocking condition, rather than the accumulated wait time across all affected sessions and collection occurrences.
Index Fragmentation Detection Time
The Index Fragmentation report now uses the object's STAMP value from the time when fragmentation was detected.
Previously, the displayed timestamp could represent the time when the fragmentation issue was already resolved. Showing the detection time provides more useful historical context and makes it easier to determine when the fragmentation problem originally appeared.
Internal Virtual Memory Pressure Report
The Memory > Internal Virtual Memory Pressure report now provides additional information when report objects are empty because the required SMT checks are disabled in the default/base configuration.
This is mainly a usability improvement. Virtual Address Space monitoring has limited practical value on modern 64-bit SQL Server systems and is therefore disabled by default, but the report now clearly explains why no data is available instead of simply presenting an empty result.
Procedure Performance Report
Procedure Performance reporting now displays values using two decimal places instead of six, improving readability while retaining sufficient precision for performance analysis.
Execution Plan – Improved Plan Waits Explanations
Additional descriptions were added to Queries > Execution Plan > Plan Waits to explain why data may not be available in specific graphs.
This makes it easier to distinguish between a genuine absence of waits and situations where the required source data or collection mechanism is not available.
Execution Plan – New ANSI Setting Color Coding
Execution Plan reporting now uses improved color coding for ANSI and SET options, making potentially problematic settings easier to identify when reviewing an execution plan.
Differences in connection and session SET options can influence plan behavior and plan reuse, so exposing these conditions more clearly helps administrators identify configuration-related execution plan issues more quickly.
Execution Plan – Improved Cursor Plan Support
Execution Plan reporting now properly supports cursor execution plans, improving the analysis of workloads where PopulateQuery, FetchQuery, and other cursor-related plan structures are present.
Execution Plan – SMT Waits in Plan Waits
The Plan Waits section in Query Plan Detail now also supports wait information collected directly by SMT. This provides another source of wait information when analyzing query execution behavior and helps users correlate execution plans with observed wait activity.
SMT Collection Reliability
The SMT collection framework itself has been hardened against possible deadlock situations. Several internal components were reviewed and adjusted to reduce the possibility of contention during concurrent collection and reporting activity.
Bug Fixes
Internal Garbage Collector Deadlock Prevention
Fixed an issue in the internal garbage collector that could cause deadlocks in SMTBOX when multiple concurrent requests arrived at the same time.
The internal cleanup logic was adjusted to handle concurrent activity more safely.
Query Plan Collection for Internal SQL Server Processes
We identified the reason why SMT did not correctly collect execution plans for some queries. The affected workload originated from internal SQL Server processes associated with mssqlsystemresource.
SMT now correctly identifies these internal processes and reports them as such. When an execution plan cannot be provided for this type of internal query, SMT reports the query without a plan while still exposing its object name where available.
Execution Plan Storage Compression
Fixed a rare condition where SMT was unable to store a newly collected execution plan because of an issue occurring during plan compression.
The plan storage logic has been hardened to handle these situations correctly.
Plan Fixing Restricted for SMT Internal Processes
Removed the possibility of applying SMT plan-fixing functionality to SMT's own internal SQL Server processes. Plan management operations are now restricted to appropriate user workload.
Replication Monitoring Collection
Further improvements were made to the Replication Monitor collection logic for environments where replication has been removed or where an instance is no longer actively replicating data.
These changes improve the handling of topology changes and prevent unnecessary or incorrect collection attempts after replication configuration has changed.
Plan Generation Number Collection
Fixed a bug preventing correct collection of the Plan Generation value.
Plan Generation is useful when investigating frequent query recompilation because it helps administrators understand how many times the cached execution plan has been regenerated.
CPU Collection Deployment in Availability Groups
Fixed automatic deployment of the new CPU collection introduced in SMT 1.14.0 when the SMT database itself is running in an Availability Group.
The updated CPU collection components are now correctly deployed to the secondary replica as part of the update process.
Queries > A/B Testing – Database Filter
Fixed a development issue that prevented the Database filter from working correctly in Queries > A/B Testing.
Queries > A/B Testing – Top Query Performance
The Top Query Performance (Based on SMT Collection) section in A/B Testing now displays CPU time in seconds instead of milliseconds, providing a more readable comparison for typical workloads.
The report was also changed to use a more reliable source from the performance metrics already available in SMT, improving consistency of the reported results.
Current Activity – Sessions without Resolved Query Text
Fixed an issue in Current Activity where an actively running session could be missing from the report when SMT was unable to resolve its query text.
Running sessions are now reported even when their query text cannot be resolved.
Instance Dashboard – Empty Top Current Requests Rows
Fixed a rare issue in Instance Dashboard where the Top Current Requests table could display empty rows.
Report URLs Now Preserve Monitored Instance Context
Fixed several report links that did not preserve the selected monitored instance.
The issue affected some links from Query Regression alerts and Storage > Database Size and Growth Trends. In those cases, following the URL could open the correct report but display data for the instance most recently selected by the user in SMT instead of the instance associated with the original link.
The monitored instance context is now correctly preserved in these URLs.
Plan Operators Performance for Very Large Execution Plans
Performance of the Plan Operators report has been optimized for very large execution plans, including plans containing more than 700 operators.
This significantly improves report usability when analyzing complex plans with large operator trees.
Plan Operators and Plan Guides
Fixed Plan Operators reporting for execution plans that have been fixed using a Plan Guide.
Previously, applying a Plan Guide could change the Plan Hash and prevent SMT from finding the corresponding performance information. The report logic has been updated so that operator statistics remain available after a Plan Guide is deployed.
Closing Notes
SMT 1.14.1 continues the improvements introduced with SMT 1.14.0 by adding deeper memory analysis, bringing Plan Explorer into production, and improving the accuracy and reliability of several core monitoring and troubleshooting workflows.
The new Memory Grants report provides much greater visibility into query workspace memory pressure, while the production version of Plan Explorer brings estimated and actual execution behavior together in a visual form that makes complex plans easier to understand.
At the same time, numerous improvements across collection, execution plan reporting, topology monitoring, replication, A/B Testing, and internal SMT processing continue to improve reliability for day-to-day SQL Server monitoring and performance analysis.
We hope you enjoy SMT 1.14.1 and, as always, we look forward to your feedback.