SMT 1.14.0 Release Notes
We are pleased to announce SMT 1.14.0, a major release focused on custom reporting, modern visualization, advanced SQL Server performance analysis, and better operational control.
This release introduces Custom Pages, a completely new chart library, Query Recompile Cause analysis, Plan Guide management, direct monitoring control from the web application, management group configuration improvements, and many important enhancements and fixes across SMT.
Flagship Feature: Custom Pages
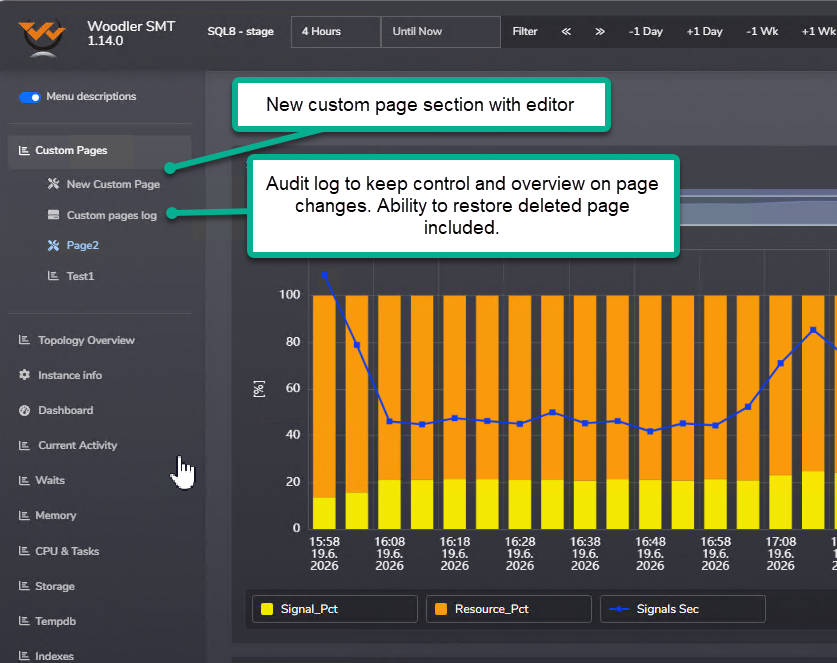
SMT 1.14.0 introduces Custom Pages, allowing users to build their own dashboards from existing SMT graphs and tables. You can now combine report objects into a custom view focused on the areas that matter most to you and your team.
This feature helps DBAs and operations teams work more efficiently by creating tailored monitoring pages for specific servers, workloads, environments, or troubleshooting scenarios.
- Create your own dashboard pages from existing SMT report objects.
- Combine graphs and tables into one custom report.
- Use the built-in editor to manage page layout and content.
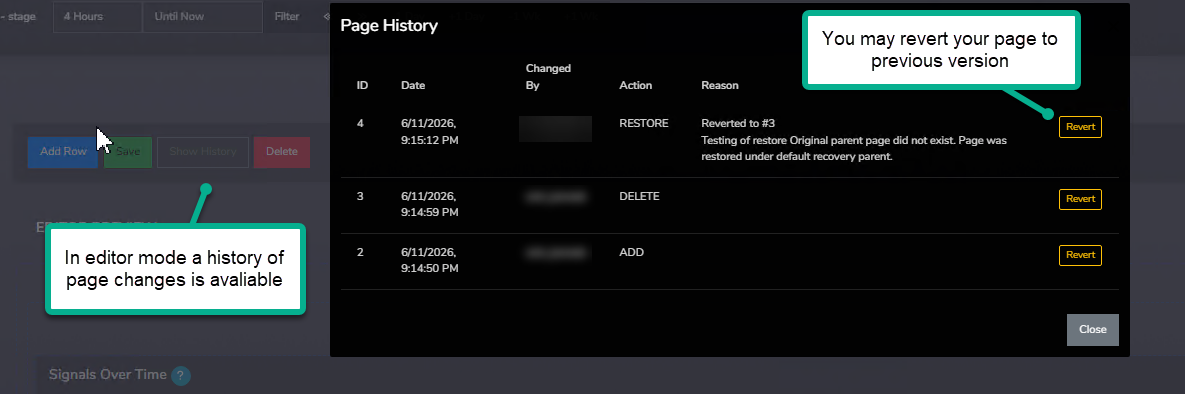
- Review page change history through the audit log.
- Revert pages to previous versions.
- Restore deleted pages when needed.

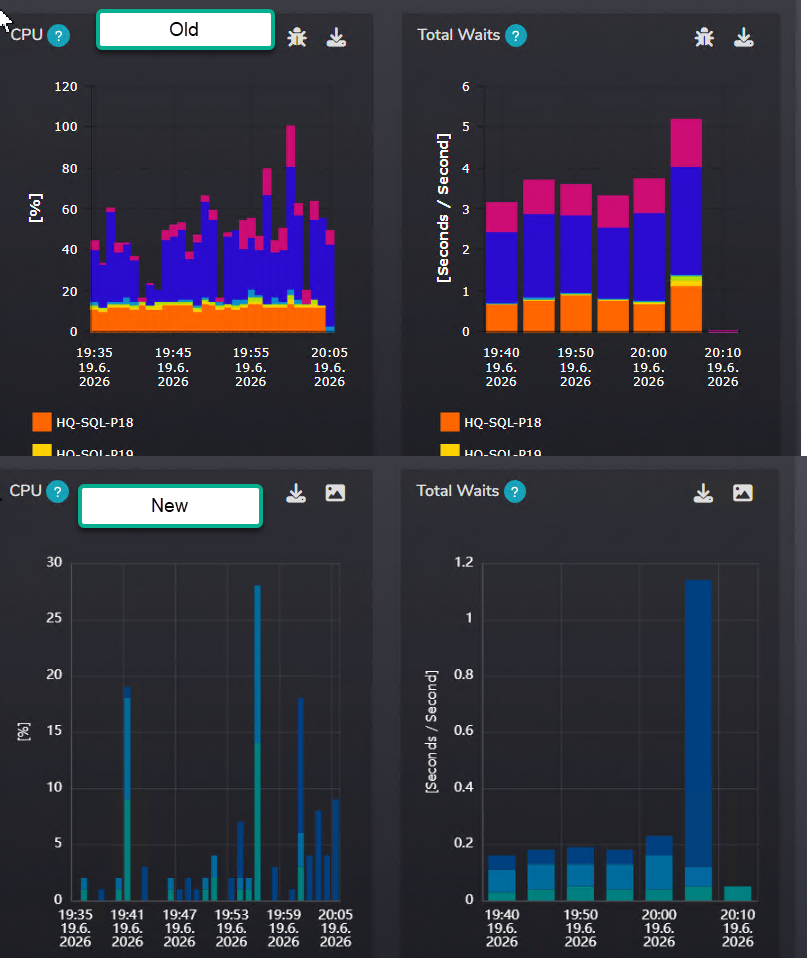
New Chart Library
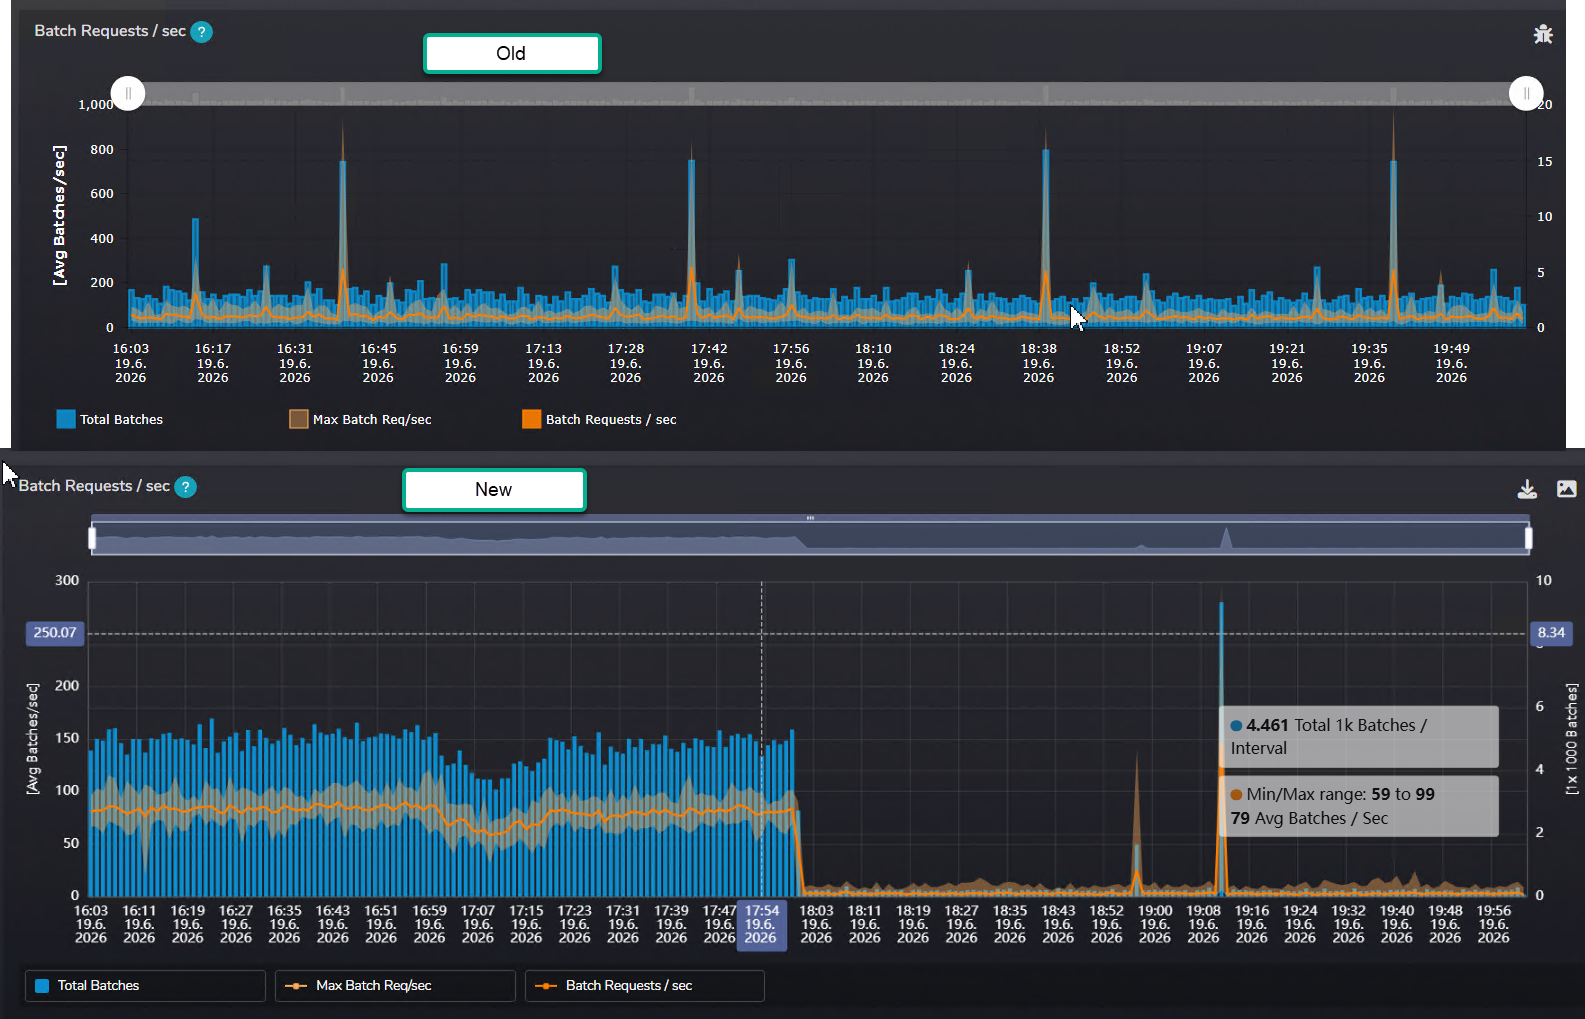
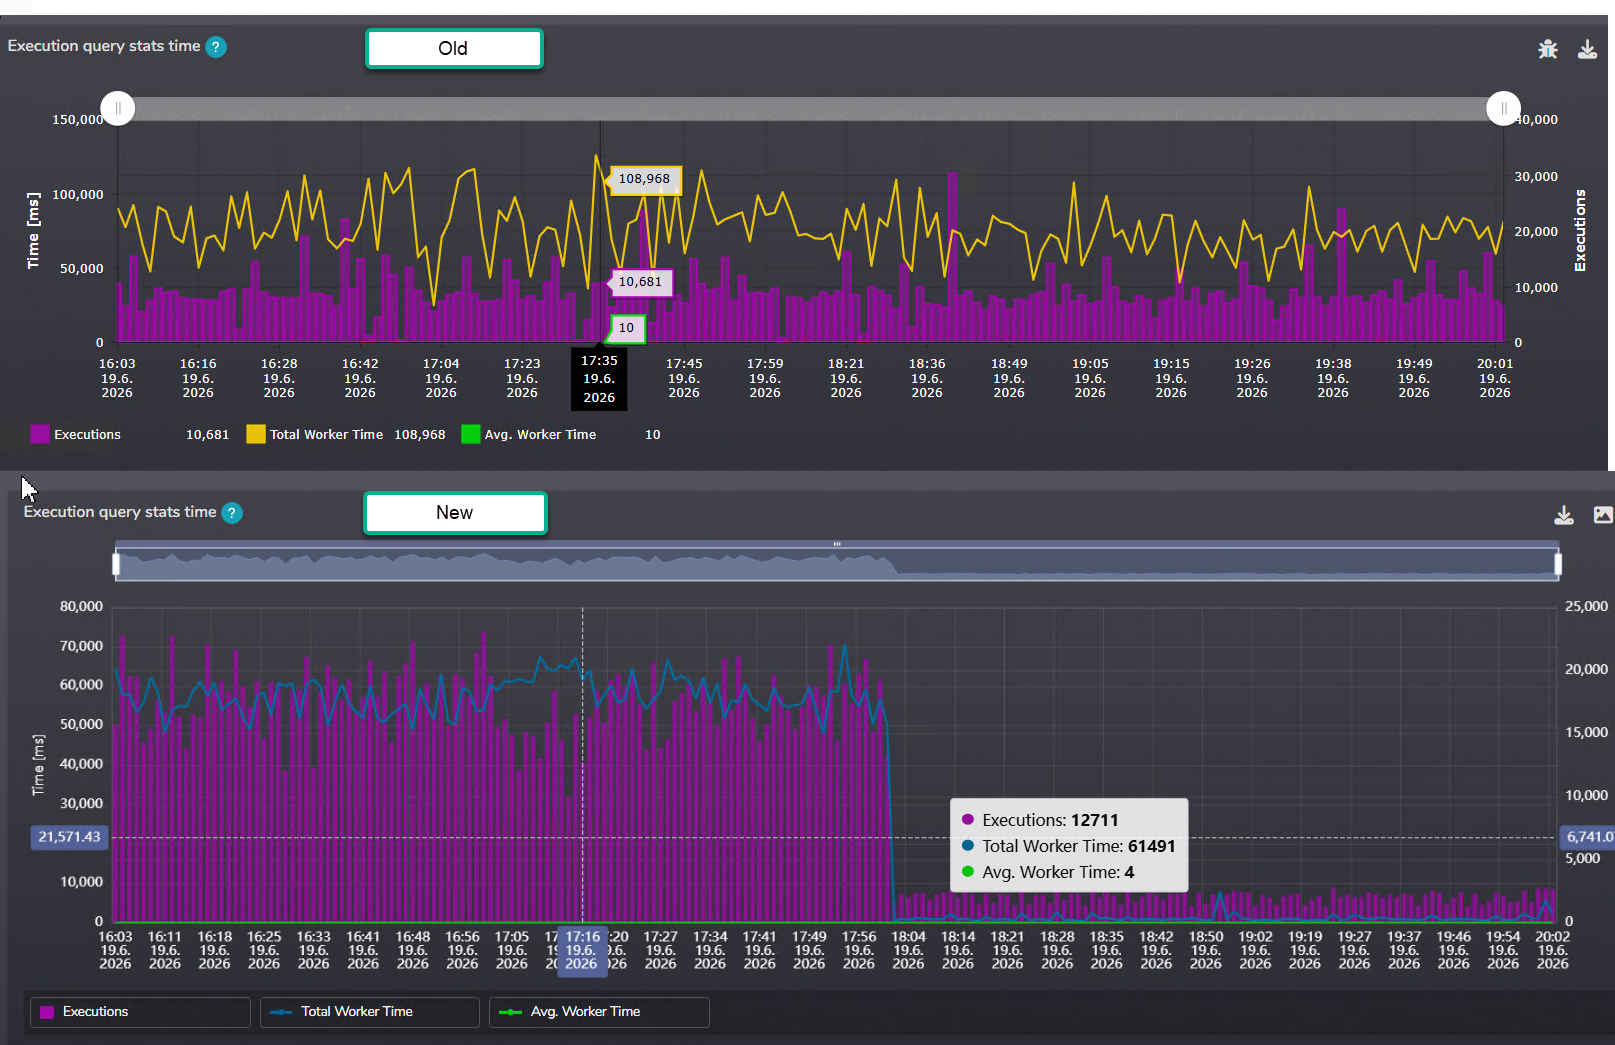
SMT 1.14.0 introduces a new chart library designed to keep the application modern, improve graph rendering performance, and provide better visual clarity.
The new charts are faster, sharper, and support high-DPI rendering. This change also opens the door for upcoming features such as click-through analysis and additional graph types.
- Improved graph rendering performance.
- Better visual clarity and modernized chart layout.
- High-DPI rendering support.
- Improved continuity of chart updates.
- Foundation for future interactive reporting features.
Query Recompile Cause Analysis
Query recompilation storms can be difficult to evaluate without understanding why recompilations happen. SMT 1.14.0 introduces new graphs that help administrators analyze query recompilation causes over time.
You can now review recompilation reasons such as ANSI setting changes, temporary table usage, column statistics changes, query hints, and other causes directly in SMT.
This feature is available in: CPU & Tasks > SQL Process CPU Counters > Query Executions & Throughput.
- Analyze query recompilation volume and frequency.
- Understand specific recompilation reasons.
- Differentiate between application design behavior and problematic recompilation storms.
- Identify workloads affected by statistics changes or OPTION RECOMPILE usage.
Plan Guide Management and Query Plan Freeze
SMT 1.14.0 adds the ability to review and manage SQL Server Plan Guides directly from SMT. Users can now access the new Queries > Plan Guides report to review existing Plan Guides and perform management operations when needed.
A new FREEZE button was also added to the Execution Plan Detail report. This allows users to create a Plan Guide for a selected execution plan directly from SMT.
- Review existing Plan Guides.
- Create Plan Guides from selected execution plans.
- Disable or remove Plan Guides when needed.
- Use the FREEZE button from Execution Plan Detail.
- Track operations through SMT event logging.
Control Monitoring from the Web Application
Administrators can now control monitoring directly from the SMT web application. This is especially useful during patching windows, outages, migrations, or maintenance operations.
From Topology Overview > Monitored Topology, users can now pause monitoring for a specified time or restart the monitoring service.
- Pause monitoring for a selected instance or management group.
- Restart the monitoring service from SMT.
- Reduce unwanted notification noise during planned maintenance.
- Resume monitoring when maintenance is completed.
Management Group Configuration
Configuration changes can now be applied to a whole management group of monitored instances. This helps administrators manage larger SMT installations more efficiently.
- Apply check configuration changes to a selected management group.
- Apply parameter configuration changes to multiple instances at once.
- Reduce repetitive configuration work in larger environments.
Major Improvements
Query Analysis and Execution Plans
- Query Summary: Added the new Most Intensive Queries per Sample Interval graph. This helps administrators identify which queries were responsible for workload spikes inside a selected sample interval.
- Query Summary Timeline: The Timeline tab was reworked to show top queries per day and top queries per sample interval together with workload KPI context. This provides a more detailed view of workload behavior over time.
- Execution Plan Detail: Query plan warnings are now exposed directly on the plan properties page. Important plan warnings are highlighted so users can quickly notice potential execution plan pitfalls.
- Plan Explorer: The Plan Explorer received a major update. More plan execution details are now visible on operator detail level, and users can switch between estimated and actual plans when both are available.
- Plan Operators Report: The report was redesigned and now includes additional Last Plan statistics, including Actual Cost %, Actual CPU Cost, and Actual IO Cost.
- Estimated vs Actual Comparison: Plan Operators now use comparison bar visualization, making it easier to understand where the actual execution plan behavior drifted from the optimizer estimate.
Monitoring and Collection
- Removed xp_cmdshell dependency: SMT no longer relies on
xp_cmdshellfor CPU statistics monitoring. This improves security posture by avoiding dependency on a configuration that is often disabled in secure SQL Server environments. - PowerShell-based CPU collection: CPU statistics collection now uses PowerShell instead.
- Per-core CPU monitoring: SMT now provides CPU monitoring per individual CPU core. This helps uncover cases where only a fraction of CPU cores are overloaded while the average CPU value still looks acceptable.
- CPU check interval requirement: Due to the new CPU collection method, CPU check intervals must now be configured in multiples of 60 seconds.
- Topology Overview: Monitoring health signaling was improved. The Online column now better differentiates between a SQL Server instance being unavailable and SMT monitoring not actively collecting data.
- Collection scheduling: Collection logic was improved so that planned collection start time is preserved even when individual checks take longer to execute.
Graph Colors and User Experience
- Based on positive feedback from SMT 1.13 table data bar color changes, SMT 1.14.0 applies the same color logic to graphs.
- Red is now reserved for important or critical situations.
- Yellow and orange now indicate values requiring attention.
- Informational graph data now uses calmer blue shades.
- This makes SMT reporting visually more consistent and closer to common monitoring industry standards.
Index Analysis
- Index Operations Report: Added the new IsUnused metric. This allows users to quickly identify indexes that are not being used but still generate write overhead.
- Index List Report: Schema name was removed from the displayed index name to improve readability and provide a cleaner visual experience.
- Deleted indexes: Deleted indexes now have proper red color coding, making it clear that the index was removed.
- Duplicate index detection: SMT now provides warnings for duplicate and possible duplicate indexes.
- Duplicate indexes are marked in orange as possible candidates for removal, while covering indexes are marked in yellow as indexes SMT suggests keeping.
Storage and Data Footprint
- WhoIsActive check: Added compression for the WhoIsActive storage table. This significantly reduces space usage when the check is configured with a low collection interval.
- Execution plan storage: Added compression for the execution plan table to reduce storage footprint.
- This allows SMT to retain more execution plans while using less database space.
- Query plan collection: Query plan collection was extended to every query used inside a module. SMT now stores one plan per combination of query hash and module.
- This helps distinguish the same query executed in different stored procedures or module contexts.
- For ad-hoc queries, behavior remains unchanged from SMT 1.13.
TempDB and ADR
- Persisted Version Store report: TempDB reports now include the first version of the Persisted Version Store report.
- This report is useful for environments using Accelerated Database Recovery, helping administrators evaluate ADR internals.
- Further improvements to this report are planned for future SMT releases.
API Access
- Users can now create access tokens from User Settings > Access Tokens.
- Access tokens allow users to call the SMT API from third-party tools and use SMT reporting data in external applications.
Additional Improvements
- Query Regression Alerts: Added the new
@QR_DATABASES_EXCLUDEparameter. Users can now exclude selected databases from Query Regression alerting. - Query Summary: Added interval-based top query analysis to provide better visibility into workload spikes.
- Execution Plan Detail: Plan warnings are now available in one place and highlighted for better visibility.
- Plan Explorer: Operator details were expanded to provide deeper insight into plan execution behavior.
- Query Collection: Plan collection was improved to better support queries running inside modules.
- Session Waits: The Session Waits check was fixed for Azure Managed Instance. It must still be enabled manually.
- Topology Overview: The monitored topology table now provides clearer monitoring health status.
- Management Group Configuration: Check configuration and parameter configuration can now be applied to a whole management group of monitored instances.
Bug Fixes
Deployment and Compatibility
- Fixed deployment and update issues on some case-sensitive SQL Server instances where inconsistent object casing caused deployment features to fail.
- The SMT codebase was adjusted for better compatibility with case-sensitive collations to prevent similar issues in future builds.
Execution Plan Reports
- Fixed cursor plan handling involving PopulateQuery and FetchQuery.
- Resolved issues with cursor attributes, total plan cost, and graphical execution plan rendering.
- Fixed duplicate values in Plan Performance Attributes for cursor plans.
- Fixed a root cause where batches containing more than one statement could cause duplication of actual runtime values.
- Fixed missing runtime plan statistics when Last Plan was available.
- Corrected incorrect classification of some Last Plans as estimated plans.
- Fixed missing Last Plan memory grant values in Execution Plan reports.
Query Reports and Query Collection
- Query Hash List Report: The report now displays proper Query Hash instead of internal SMT Plan ID.
- Query Detail and Query Hash Detail: Fixed discrepancies between execution metrics in both reports.
- Corrected calculations for MAX values and executions per minute.
- Fixed query plan and query text mismatches in performance data collection.
- The root cause was matching only by
query_plan_hash, which could produce mismatches when different queries shared the same plan hash. - Collection logic now matches using both
query_plan_hashandquery_hash. - Additional improvements were made to handle multiple plans with the same plan hash, parameters, and plan attributes.
Regression Alerts
- Fixed incorrect URLs in Query Regression alert messages.
- Added database name to regression alert reporting for easier filtering.
- Fixed issues with sending regression alerts to Jira Helpdesk through Pushcore.
- Improved alert notification logic for Pushcore and email delivery.
- Corrected behavior of
QR_NOALERTINGandQR_CUSTMAILparameters.
Parameters Configuration
- Fixed an issue where the
QR_HASHFILTERparameter did not work as expected because of a datatype mismatch in comparison logic. - Fixed
QR_DATABASESparameter handling. - Corrected multi-value filter support for database parameters.
- Fixed inconsistent HEX conversion logic across different query regression parameter modes.
Monitoring and Reporting
- CPU Task Handling Report: Fixed a graph showing timeline data in unsorted order.
- Storage Performance Report: Fixed inconsistent values across separate storage reports.
- Index Detail Reports: Fixed graph interpretation issues where unknown values at the end of an open interval were displayed as zero.
- Graphs now avoid drawing unknown values as zero and instead do not display the graph line where the value is not known.
- Spin Lock Reports: Fixed a rare arithmetic overflow in spinlock statistics.
- Stored Procedures Reports: Fixed an integer overflow caused by aggregation issues and unexpected DMV values.
- A filter was added to exclude negative values from analysis where DMV data could return invalid elapsed time values.
- Query Search: Fixed discrepancies between CPU and Duration column descriptions and the real reported values.
- Added decimal precision for very small reported values.
Replication Monitoring and Topology
- Reduced observer overhead of Replication Monitoring on distribution databases with many subscriptions and articles.
- Replication collection logic was refactored to keep performance overhead very low.
- Fixed rare delays in Topology Overview when many instances were monitored by one SMT installation.
- Improved data transfer logic between collection and application reporting.
- Added an option to partition reporting data per monitored instance to prevent processing conflicts when many instances are handled at once.
Managed Instance Compatibility
- Fixed Session Waits report compatibility with Azure Managed Instance.
- The check now works on Managed Instance, but must be enabled manually.
Closing Notes
SMT 1.14.0 is a significant step forward in customization, visualization, troubleshooting depth, and operational control. With Custom Pages, the new chart engine, Query Recompile Cause analysis, Plan Guide management, and improved management group configuration, SMT gives administrators more flexibility and deeper insight into SQL Server behavior.
We hope you enjoy this release and look forward to your feedback as we continue improving SMT.